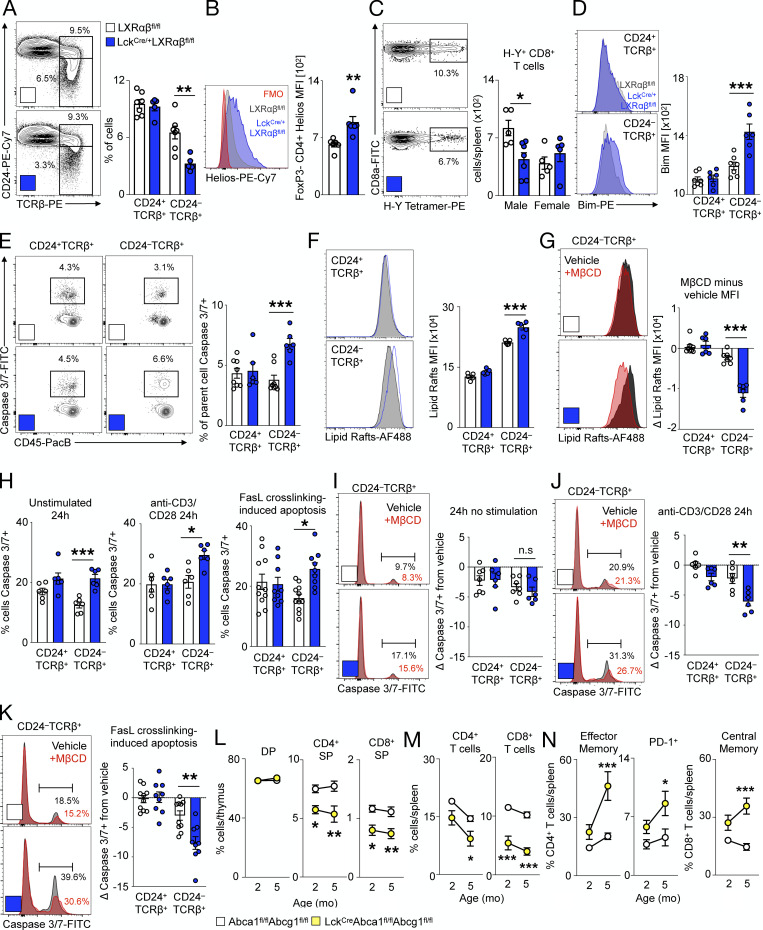
Figure 5.
LXRαβ prevents negative selection of thymocytes via plasma membrane lipid rafts and Abca1/Abcg1. (A–J) From 2-mo-old LXRαβfl/fl and LckCre/+LXRαβfl/fl mice. (A) Representative plots and frequency/mean fluorescence intensity (MFI) of CD24+TCRβ+ and CD24−TCRβ+ thymocytes (n = 5–7 per group from at least two independent experiments. **P < 0.01). (B) MFI of Helios+CD4+FoxP3− SP thymocytes (n = 6 or 7 per group from at least two independent experiments. **P < 0.01). (C) Splenic H-Y+ CD8+ T cells (n = 5–7 per group from at least two independent experiments. *P < 0.05. (D) Bim expression of CD24+TCRβ+ and CD24−TCRβ+ thymocytes (n = 6 or 7 per group from at least two independent experiments, where ***P < 0.001). (E) Caspase 3/7+ CD24+TCRβ+ and CD24−TCRβ+ thymocytes (n = 6–8 per group from at least two independent experiments.) ***P < 0.001. (F and G) Representative plots and MFI of lipid raft staining (F; cholera toxin B) and change in lipid raft MFI after vehicle or MβCD ex vivo(G). Data are n = 6 or 7 per group from at least two independent experiments. ***P < 0.001. (H) Quantification of apoptotic thymocytes left unstimulated or treated with anti–CD3/CD28 for 24 h or Fas/FasL cross-linked thymocytes for 4 h. (I–K) Change in apoptosis after ex vivo MβCD compared with vehicle in thymocytes left unstimulated for 24 h (I), stimulated with anti–CD3/CD28 for 24 h (J), or stimulated with Fas/FasL cross-linking for 4 h (K). (H–K) Data are n = 5–9 per group from at least two independent experiments. *P < 0.05, **P < 0.01, and ***P < 0.001. (L–N) From 2–5-mo-old Abca1fl/flAbcg1fl/fl and Lck-A1G1−/− mice (n = 6–8 per group), frequency of thymocyte subsets (L), splenic CD4+ and CD8+ T cells (M), and splenic activated/PD-1+ CD4 and activated CD8 T cells (N). Data are n = 6–8 per group from two independent experiments. *P < 0.05, **P < 0.01, ***P < 0.001. Statistical analysis used was Student’s t test or two-way ANOVA followed by Bonferroni’s post-test (repeated measures performed in G and H). All data are mean ± SEM.

