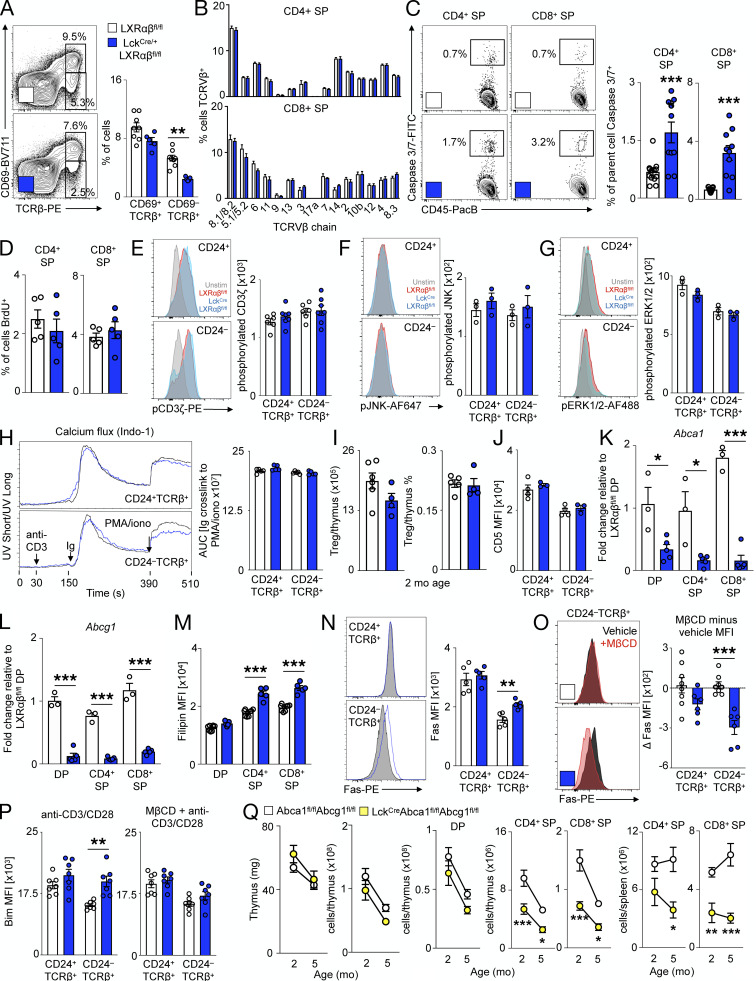
Figure S4.
Thymocyte LXRαβ prevents excessive negative selection. From 2-mo-old LXRαβfl/fl and LckCre/+LXRαβfl/fl mice. (A) Representative plots and frequency of CD69+TCRβ+ and CD69−TCRβ+ thymocytes. Data are n = 5–7 per group from two independent experiments. **P < 0.01. (B) Frequency of CD4+ SP or CD8+ SP thymocytes expressing different TCRVβ chains. Data are n = 5 per group, representative of two independent experiments. (C) Frequency of Caspase3/7+ thymocytes. Data are n = 9 or 10 per group from three independent experiments. ***P < 0.001). (D) Frequency of BrdU+ thymocytes (2-h pulse). Data are n = 5 per group, representative of two independent experiments. (E–H) Thymocytes stimulated ex vivo with anti-CD3 (10 µg/ml) and anti-CD28 (2 µg/ml) for 5 min and representative plots and mean fluorescence intensity (MFI) of phosphorylated CD3ζ (E), phosphorylated JNK (F), and phosphorylated ERK/12 (G), and representative Indo-1 calcium flux from TCR cross-linking of CD24+TCRβ+ or CD24−TCRβ+ thymocytes and quantification of area under the curve (AUC) of Ig-induced cross-linking (H). (E–G) Data are n = 3–8 per group and are representative of two independent experiments. (H) Data are n = 5 per group representative of two independent experiments. (I) Enumeration and frequency of T reg cells. Data are n = 4 or 5 per group and are representative of two independent experiments. (J) CD5 MFI. Data are n = 3 or 4 per group and are representative of two independent experiments. (K and L) Real-time PCR expression of Abca1 (K) and Abcg1 (L) from FACS-sorted thymocytes. Data are n = 3 per group and are representative of two independent experiments. *P < 0.05, ***P < 0.001. (M) Quantification of thymocyte filipin MFI. Data are n = 5–8 per group from two independent experiments. ***P < 0.001. (N) Representative plots and thymocyte Fas MFI. Data are n = 5 per group and are representative of three independent experiments. **P < 0.01. (O) Change in thymocyte Fas MFI after MβCD or vehicle treatment ex vivo. Data are n = 6–8 per group from three independent experiments. ***P < 0.001. (P) Thymocyte Bim MFI after 4-h anti–CD3/CD28 stimulation with or without MβCD treatment. Data are n = 7 per group from two independent experiments. **P < 0.01. (Q) From 2–5-mo-old Abca1fl/flAbcg1fl/fl and Lck-A1G1−/− mice, thymus weight and cellularity, enumeration of splenic CD4 and CD8 T cells, and enumeration of splenic activated/immunoinhibitory CD4+ and activated CD8+ T cells. Data are n = 6–8 per group from two independent experiments. *P < 0.05, **P < 0.01, ***P < 0.001. Statistical analysis used was Student’s t test or two-way ANOVA followed by Bonferroni’s post-test. All data are mean ± SEM.

