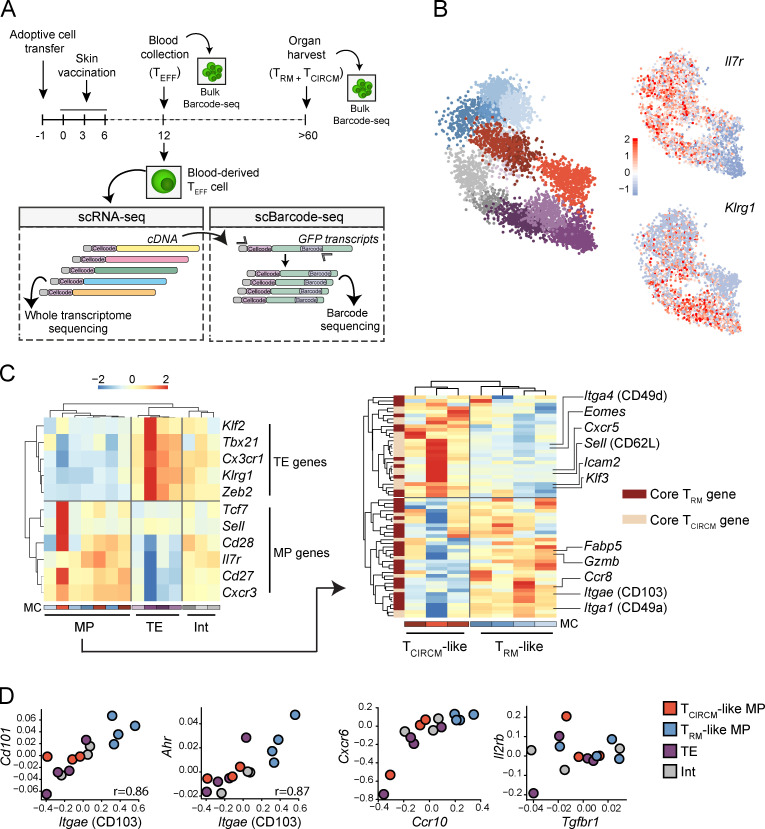
Figure 4.
scRNA-seq reveals a transcriptional TRM-like MP state in the circulating TEFF pool. Barcode-labeled TEFF were isolated from blood of recipient mice at day 12 after skin vaccination, and scRNA-seq was performed to map transcriptional profiles of circulating effector cells. In addition, barcode sequences were specifically amplified from single cell–derived cDNA and subsequently sequenced (single-cell barcode sequencing). Matching of cellcode sequences (sequences marking all transcripts derived from a single cell) in scRNA-seq and single-cell barcode sequencing datasets allows for the coupling of transcriptional profile and clone of origin of individual TEFF cells. (A) Schematic overview of the experimental procedure. (B) Left: 2D projection of 5,383 TEFF cells that, based on transcriptional profile, are grouped into 14 distinct MCs. MC colors indicate assigned TEFF state, as defined in C (red/brown, TCIRCM-like; blue, TRM-like MP; purple, TE; gray, Int). Right: 2D projections with superimposed expression of Il7r and Klrg1. Legend indicates gene expression Z-score. (C) Left: Hierarchical clustering of 14 transcriptionally distinct MCs based on the expression of TE- and MP-associated genes. Legend indicates log2 enrichment Z-score. Right: Hierarchical clustering, based on the expression of core TRM and TCIRCM genes, of the seven MCs that are classified as MP. (D) Gene expression comparison of genes associated with skin TRM biology between the four defined TEFF transcriptional states (i.e., TCIRCM-like, TRM-like MP, TE, and Int). Values on axis represent log2 enrichment Z-score. Spearman correlation r, P < 0.005. In B–D, data were obtained from three mice.

