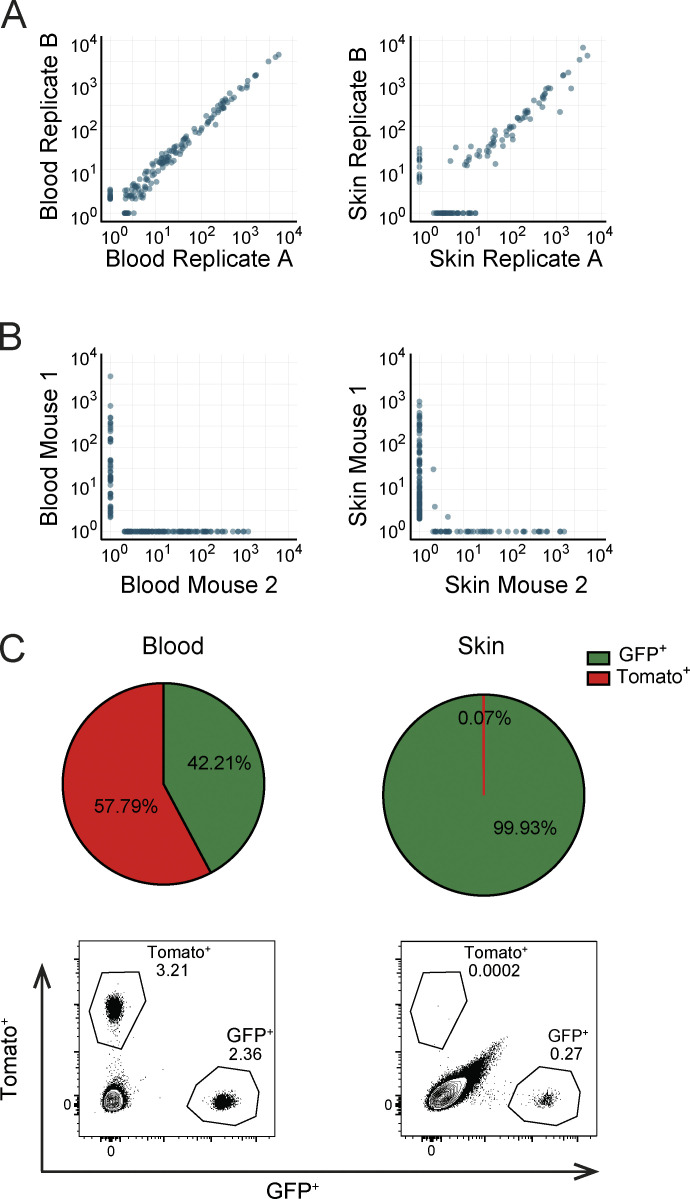
Figure S1.
Quality of barcode quantification and analysis of blood-borne T cell contamination in effector-phase skin samples. (A and B) Recipients of barcode-labeled T cells were vaccinated, and whole blood and organs were harvested 12 d after first vaccination. (A) Measured clone sizes detected in representative technical replicates of blood (left) and skin (right) samples. (B) Measured clone sizes detected in blood (left) and skin (right) of independent mice. Dots represent individual clones. (C) Analysis of the presence of blood-borne T cells in skin preparations. Recipients of GFP+ OT-I T cells were DNA vaccinated. 10 d after vaccination, mice received 1.5 × 10⁶ Tomato+ OT-I T cells and were sacrificed 5 min later. Top: Pie charts depicting the relative percentage of GFP+ and Tomato+ cells in blood (left) and skin (right) preparations. Bottom: Representative flow cytometry plots. Cells are gated on live lymphocytes. Data are representative of four mice.

