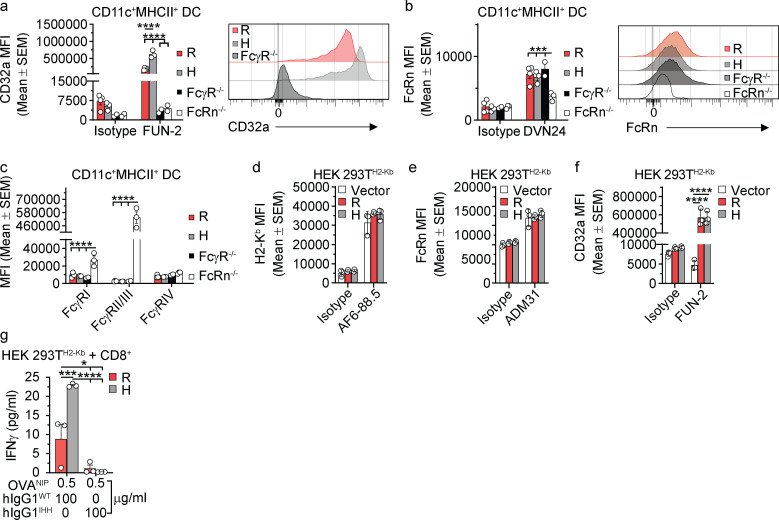
Figure S2.
Increased CD32aH-associated presentation and cross-presentation is codependent on FcRn and CD32a. (a–c) CD32a (a), mFcRn (b), and classical FcγR (c) surface expression by primary splenic CD11c+MCHII+ DCs from CD32aR-Tg (R; red), CD32aH-Tg (H; gray), FcγR−/− (black), and mFcRn−/− (white) mice (n = 3). Bar graphs representing the average MFI ± SEM, and representative histograms (right for a and b) are shown. The Fcgrt−/− mice (n = 3) served as negative and positive controls for mFcRn and classical FcγR staining, respectively. (d–f) H2-Kb (d), hFcRn (e), and CD32a (f) surface expression on CD32aR- or CD32aH- or vector control plasmid–transfected HEK 293TH2-Kb cells. For panels d–f, bar graphs display average MFI ± SEM in triplicate. (g) IFN-γ production by CD8+ OT-I T cells after 48 h of co-culture with HEK 293TH2-Kb cells expressing CD32aR or CD32aH and loaded with hIgG1WT ICs or hIgG1IHH ICs. Data are representative of two or three (a–g) independent experiments with individual points representing triplicate technical replicates. H, CD32aH; R, CD32aR; Vector, control vector. All data were analyzed by two-way ANOVA followed by the two-stage linear step-up procedure of Benjamin, Krieger, and Yekutieli with FDR controlled at <0.05. *, P < 0.05; ***, P < 0.001; ****, P < 0.0001.

