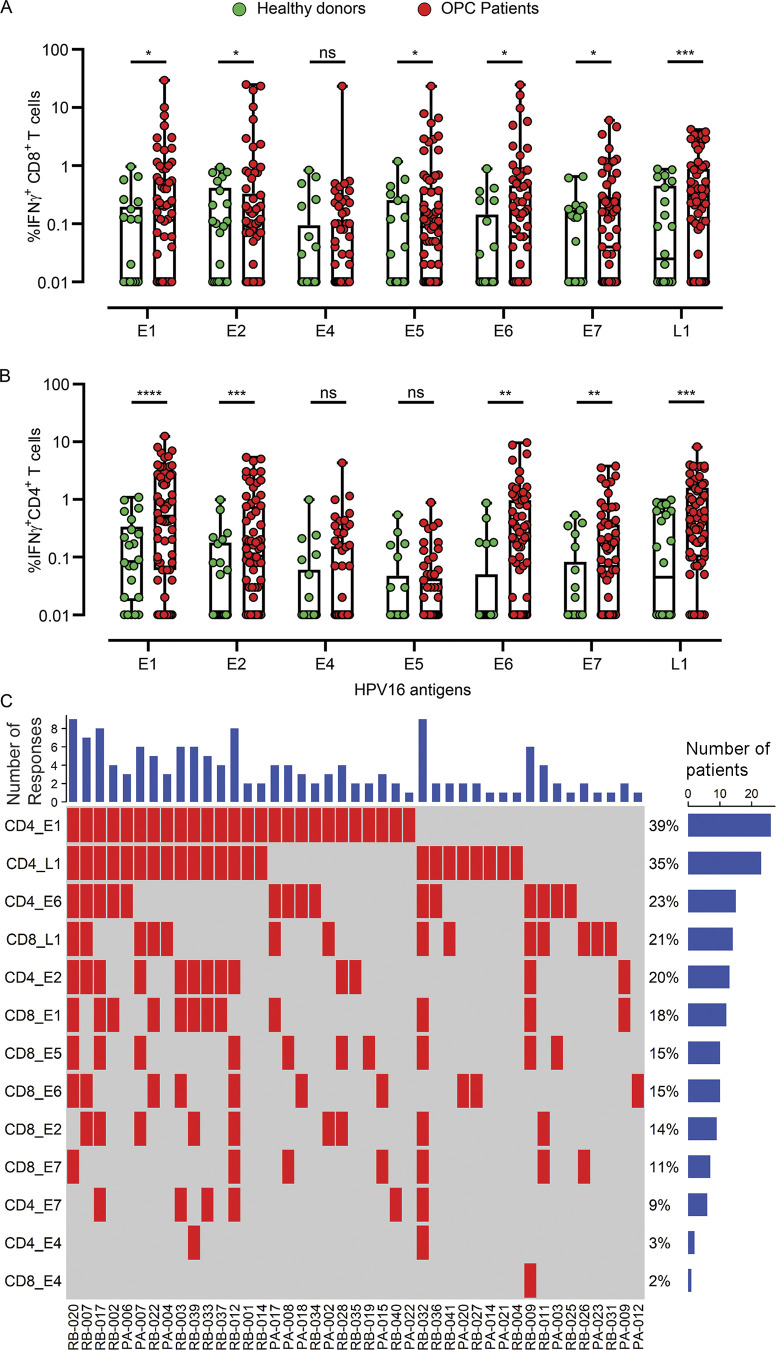
Figure 2.
Proteome-wide profiling of HPV-16–specific T cell responses in the peripheral blood of OPC patients and healthy volunteers. PBMC from OPC patients (n = 66) and healthy volunteers (n = 22) were stimulated with OPPs covering the entire sequence of HPV-encoded antigens E1, E2, E4, E5, E6, E7, and L1; cells were cultured in the presence of IL-2. On day 14, these cells were restimulated with individual antigen OPPs, and antigen-specific reactivity was assessed by intracellular IFN-γ FACS staining. (A and B) Box-and-whisker plots show HPV-16–specific CD8+ T cell (A) and CD4+ T cell (B) reactivity in OPC patients and healthy volunteers. Each patient’s sample screening was repeated a minimum of three times independently. (C) OPC patients showing CD8+ and CD4+ T cell responses ≥1% IFN-γ+ (n = 43) were analyzed using a response matrix, which was memo sorted and displayed as response plots. Each row of the response plot shows the presence or absence of a CD4+ or CD8+ T cell response to an individual HPV antigen, and each column shows the response for an individual patient. The bar graph on top shows the number of antigen-specific responses observed for each patient. The percentage adjacent to each row shows the antigen-specific T cell response frequency among all OPC patients recruited in the study (n = 66). The bar graph on the right side shows the number of patients responding to each antigen. *, P < 0.05; **, P < 0.01; ***, P < 0.001; ****, P < 0.0001; ns, not significant; two-tailed t test with Welch’s correction.

