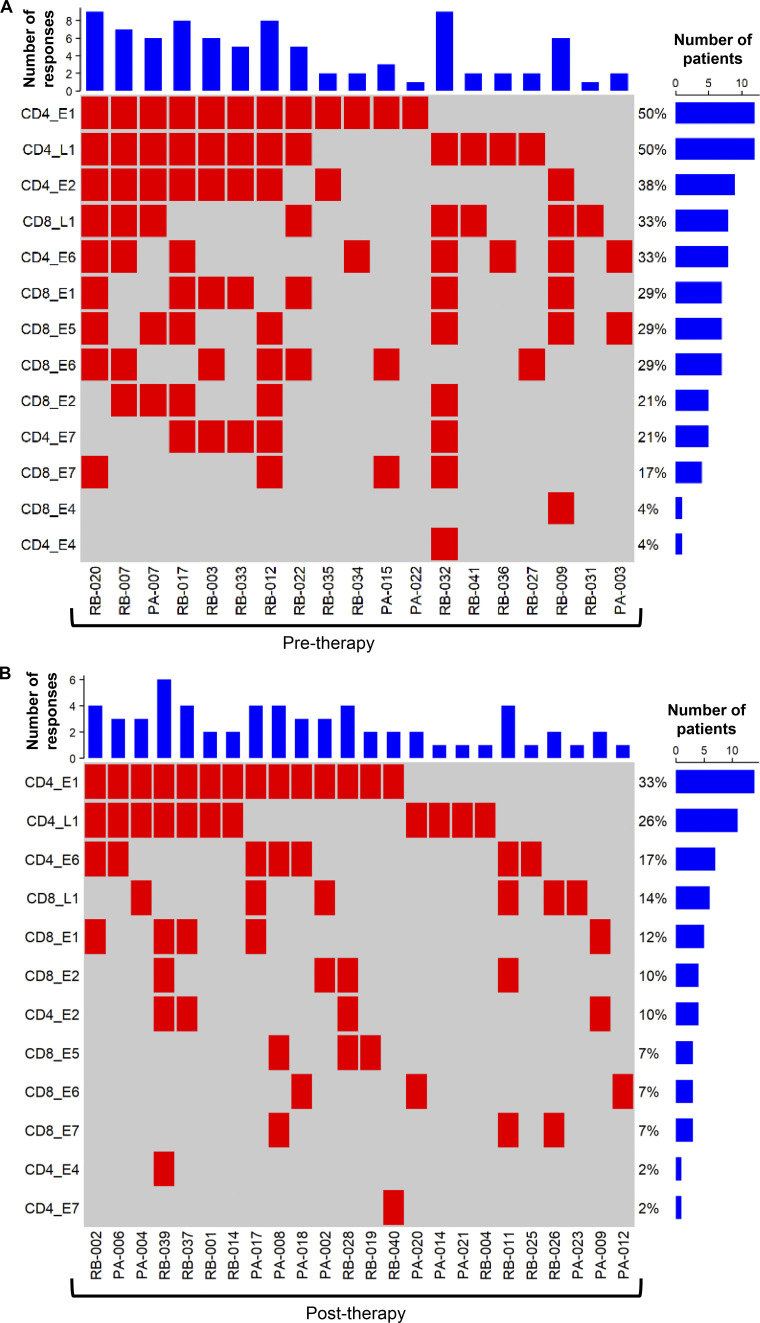
Figure 5.
Profile of HPV-specific T cell reactivity in OPC patients and the impact of curative treatment. CD8+ and CD4+ T cell responses against individual HPV antigens ≥1% IFN-γ+ were identified in 43 OPC patients, and a response matrix was derived. (A and B) The response matrix was memo sorted and plotted as response plots for patients assessed before therapy (A; n = 19) and after therapy (B; n = 24). In the response plots, each row shows the presence or absence of a CD4+ or CD8+ T cell response to an individual HPV antigen, and each column shows the response for an individual patient. The bar graph on top shows the number of antigen-specific responses observed for each patient. The percentage adjacent to each row shows the antigen-specific response frequency in the pretherapy (n = 24) and post-therapy (n = 42) patient cohorts. The bar graph on the right side shows the number of patients responding to each antigen.

