Figure 4.
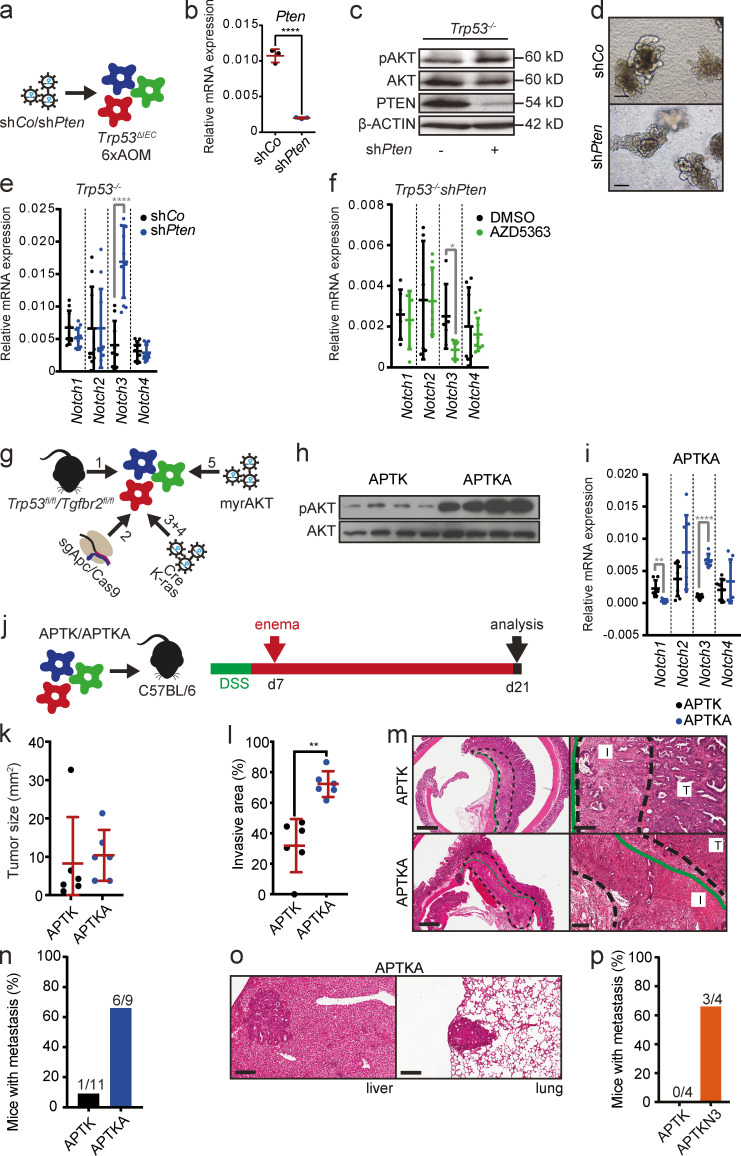
AKT signaling up-regulates Notch3 expression and induces a more aggressive phenotype. (a) Schematic representation of the strategy used for the establishment of Trp53−/− mouse tumor organoids expressing a control hairpin (shCo) or a hairpin against Pten (shPten). (b) Relative mRNA expression of Pten in Trp53−/−shCo and Trp53−/−shPten mouse tumor organoids by qRT-PCR. Data are mean ± SD of n = 1 experiment performed in triplicate; ****, P < 0.0001 by t test. (c) Immunoblot analysis of phosphorylated (p) and total (t) AKT and PTEN in Trp53−/−shCo and Trp53−/−shPten mouse tumor organoids. β-ACTIN was used as loading control. (d) Representative morphology of the Trp53−/−mouse tumor organoids with or without Pten knockdown. Scale bars = 50 µm. (e) Relative mRNA expression levels of Notch1–4 genes in Trp53−/−shCo and Trp53−/−shPten mouse tumor organoids by qRT-PCR. Data are shown for a dataset of n = 3 experiments performed in triplicate. Data are mean ± SD; ****, P < 0.0001 by t test. (f) Relative mRNA expression levels of Notch1–4 genes in DMSO- and AZD5363-treated Trp53−/−shPten mouse tumor organoids by qRT-PCR. Organoids were treated with 3 µM AZD5363 or appropriate concentrations of DMSO for 3 d. Data are shown for a dataset of n = 2 experiments performed in triplicate. Data are mean ± SD; *, P < 0.05 by t test. (g) Schematic representation of the strategy used for the establishment of APTK and APTKA mouse tumor organoids. fl, floxed; myr, myristoylated. (h) Immunoblot analysis of phosphorylated (p) and total (t) AKT in APTK and APTKA mouse tumor organoids. (i) Relative mRNA expression levels of Notch1–4 genes in APTK and APTKA mouse tumor organoids by qRT-PCR. Data are shown for a dataset of n = 2 experiment performed in triplicate and quadruplicate. Data are mean ± SD; **, P < 0.01; ****, P < 0.0001 by t test. (j) Schematic timeline of the strategy used for orthotopic transplantation of APTK and APTKA mouse tumor organoids into C57BL/6 mice. (k) Tumor size upon orthotopic transplantation of APTK and APTKA mouse tumor organoids into C57BL/6 mice. Data are shown for a dataset of n = 2 experiments with n = 6 mice per group. Data are mean ± SD. (l) Extent of the invasive area relative to total tumor size upon orthotopic transplantation of APTK and APTKA mouse tumor organoids into C57BL/6 mice. Data are shown for a dataset of n = 2 experiments with n = 6 mice per group. Data are mean ± SD. **, P < 0.01 by t test. (m) H&E-stained sections of invasive primary tumors in C57BL/6 mice orthotopically transplanted with APTK and APTKA mouse tumor organoids. T, noninvasive tumor area; I, invasive area. Dashed line demarcates the invasive area; continuous green line marks the inner border of the external muscle layer of the colon wall. Scale bars = 900 µm (left); 200 µm (right). (n) Frequency of mice with metastasis upon orthotopic transplantation of APTK and APTKA mouse tumor organoids into C57BL/6 mice. Numbers indicate mice with metastasis/all mice. Data are shown for a dataset of n = 3 experiments with n ≥ 9 mice per group. (o) H&E-stained sections of liver and lung metastasis in C57BL/6 mice orthotopically transplanted with APTKA mouse tumor organoids. Scale bars = 200 µm. (p) Frequency of mice with metastasis upon orthotopic transplantation of APTK and APTKN3 mouse tumor organoids into Rag1 mice. Numbers indicate the number of mice with metastasis/total number of mice. Data are shown for a dataset of n = 1 experiments with n = 4 mice per group.

