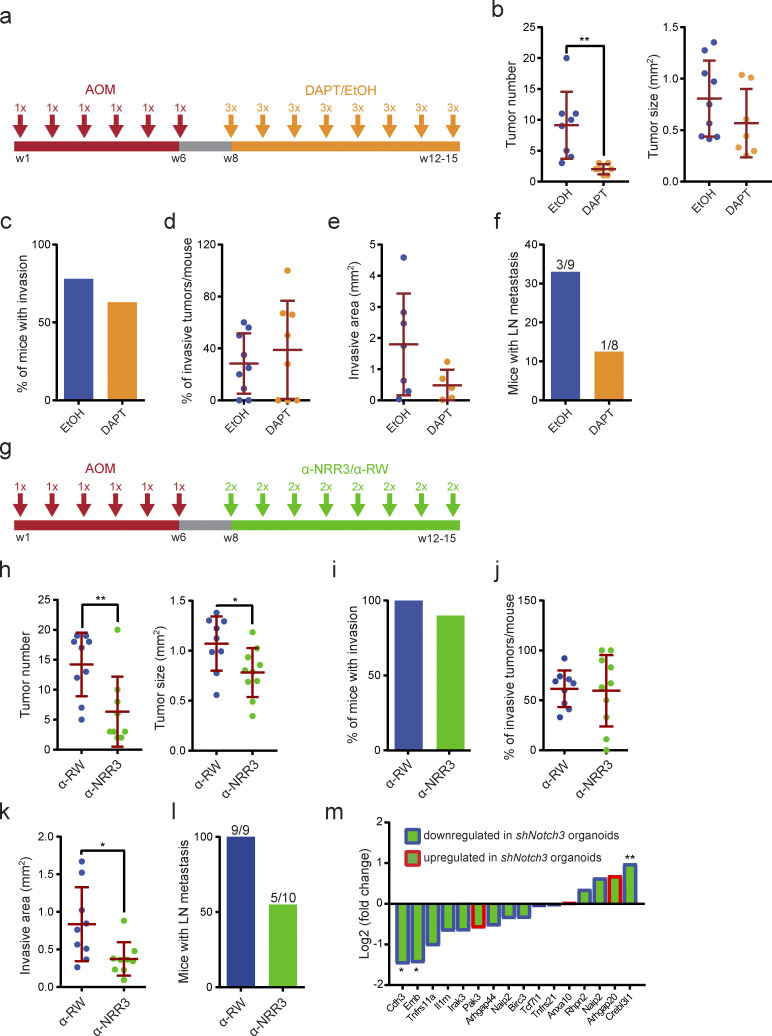
Figure 6.
In vivo NOTCH3 inhibition reduces colorectal tumor development and progression. (a) Schematic depiction of the treatment strategy of AOM-induced Trp53ΔIECAktE17K mice with DAPT or ethanol/oil mixture. DAPT was administered in a 3-d-on/4-d-off regimen at 10 mg/kg. (b) AOM-induced primary tumor number and primary tumor size in Trp53ΔIECAktE17K mice treated with DAPT or ethanol/oil mixture. Data are shown for a dataset of n = 2 experiments with n ≥ 8 mice per group. Data are mean ± SD; **, P < 0.01 by t test. Grubbs’ test with α = 0.05 was used to remove outliers. (c) Frequency of mice with AOM-induced invasive tumors in Trp53ΔIECAktE17K mice treated with DAPT or ethanol/oil mixture. Data are shown for a dataset of n = 2 experiments with n ≥ 8 mice per group. (d) Frequency of AOM-induced invasive tumors per mouse in Trp53ΔIECAktE17K mice treated with DAPT or ethanol/oil mixture. Data are shown for a dataset of n = 2 experiments with n ≥ 8 mice per group. Data are mean ± SD; not significant by t test. Grubbs’ test with α = 0.05 was used to remove outliers. (e) Extent of the invasive area in AOM-induced Trp53ΔIECAktE17K mice treated with DAPT or ethanol/oil mixture. Data are shown for a dataset of n = 2 experiments with n ≥ 5 mice per group. Data are mean ± SD; not significant by t test. Grubbs’ test with α = 0.05 was used to remove outliers. (f) Frequency of mice with lymph node metastasis in AOM-induced Trp53ΔIECAktE17K mice treated with DAPT or ethanol/oil mixture. Data are shown for a dataset of n = 2 experiments with n ≥ 8 mice per group. Numbers indicate the number of mice with metastasis/total number of mice. (g) Schematic depiction of the treatment strategy of AOM-induced Trp53ΔIECAktE17K mice with α-NRR3 or α-RW. α-NRR3 or α-RW was administered twice per week at 30 mg/kg. (h) AOM-induced primary tumor number and primary tumor size in Trp53ΔIECAktE17K mice treated with α-NRR3 or α-RW. Data are shown for a dataset of n = 2 experiments with n ≥ 9 mice per group. Data are mean ± SD; *, P < 0.05 by t test; **, P < 0.01. Grubbs’ test with α = 0.05 was used to remove outliers. (i) Frequency of mice with AOM-induced invasive tumors in Trp53ΔIECAktE17K mice treated with α-NRR3 or α-RW. Data are shown for a dataset of n = 2 experiments with n ≥ 9 mice per group. (j) Frequency of AOM-induced invasive tumors per mouse in Trp53ΔIECAktE17K mice treated with α-NRR3 or α-RW. Data are shown for a dataset of n = 2 experiments with n ≥ 9 mice per group. Data are mean ± SD; not significant by t test. Grubbs’ test with α = 0.05 was used to remove outliers. (k) Extent of the invasive area in AOM-induced Trp53ΔIECAktE17K mice treated with α-NRR3 or α-RW. Data are shown for a dataset of n = 2 experiments with n ≥ 9 mice per group. Data are mean ± SD; *, P < 0.05 by t test. Grubbs’ test with α = 0.05 was used to remove outliers. (l) Frequency of mice with lymph node metastasis in AOM-induced Trp53ΔIECAktE17K mice treated with α-NRR3 or α-RW. Data are shown for a dataset of n = 2 experiments with n ≥ 9 mice per group. Numbers indicate mice with metastasis/all mice. (m) Log2 fold change of the expression of the indicated NOTCH3 target genes in AOM-induced Trp53ΔIECAktE17K mice treated with α-NRR3 relative to α-RW treated mice by qRT-PCR. Genes with a blue frame were found to be down-regulated in Trp53−/−AktE17KshNotch3 organoids compared with control Trp53−/−AktE17KshCo organoids. Genes with a red frame were found to be up-regulated in Trp53−/−AktE17KshNotch3 organoids compared with control Trp53−/−AktE17KshCo organoids. Data are shown for a dataset of n = 1 experiments with n = 5 mice per group. *, P < 0.05; **, P < 0.01 by t test.

