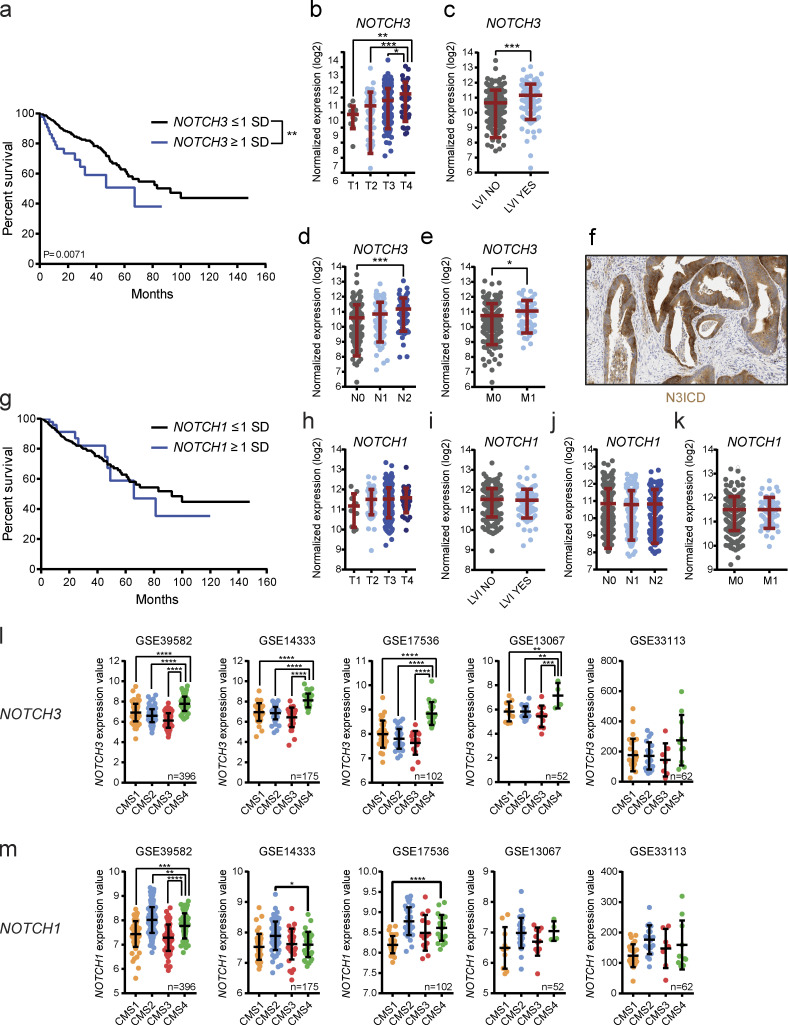
Figure 7.
High NOTCH3 expression correlates with CRC progression and CMS4 subtype in CRC patients. (a) Kaplan–Meier survival curve of CRC patients with NOTCH3 under- or overexpression. Data were generated by using the cBioPortal and TCGA RNA sequencing V2 dataset with a z-score threshold of ±1. Underexpression was considered for expression values smaller than one SD below the mean (n = 327), overexpression was considered for expression values greater than one SD above the mean (n = 46). Curve comparison was performed with log-rank (Mantel–Cox) test. (b–e) NOTCH3 normalized expression in CRC patients according to the tumor stage (T1–T4; b), LVI (c), lymphatic metastasis (N0–N2; d), and distant metastasis (M0–M1; e). Data were generated by using the cBioPortal and TCGA RNA sequencing V2 dataset with a z-score threshold of ±1. Data are mean ± SD, n = 374. *, P < 0.05; **, P < 0.01; ***, P < 0.001 by t test or one-way ANOVA followed by Tukey’s multiple comparison test. (f) Representative image of N3ICD immunohistochemistry (IHC) in human CRC. Scale bar = 100 µm. (g) Kaplan–Meier survival curve of CRC patients with NOTCH1 under- or overexpression. Data were generated by using the cBioPortal and TCGA RNA sequencing V2 dataset with a z-score threshold of ±1. Underexpression was considered for expression values smaller than one SD below the mean (n = 320), overexpression was considered for expression values greater than one SD above the mean (n = 52). Curve comparison was performed with log-rank (Mantel–Cox) test. (h–k) NOTCH1 normalized expression in CRC patients according to the tumor stage (T1–T4; h), LVI (i), lymphatic metastasis (N0–N2; j), and distant metastasis (M0–M1; k). Data were generated by using the cBioPortal and TCGA RNA sequencing V2 dataset with a z-score threshold of ±1. Data are mean ± SD; n = 374. Not significant by t test or one-way ANOVA followed by Tukey’s multiple comparison test. (l) NOTCH3 expression in the indicated human CRC datasets according to the CMS category. Data are mean ± SD; **, P ≤ 0.01; ***, P ≤ 0.001; ****, P ≤ 0.0001 by one-way ANOVA followed by Dunnett’s multiple comparison test. (m) NOTCH1 expression in the indicated human CRC datasets according to the CMS category. Data are mean ± SD; *, P < 0.05; **, P ≤ 0.01; ***, P ≤ 0.001; ****, P ≤ 0.0001 by one-way ANOVA followed by Dunnett’s multiple comparison test.

