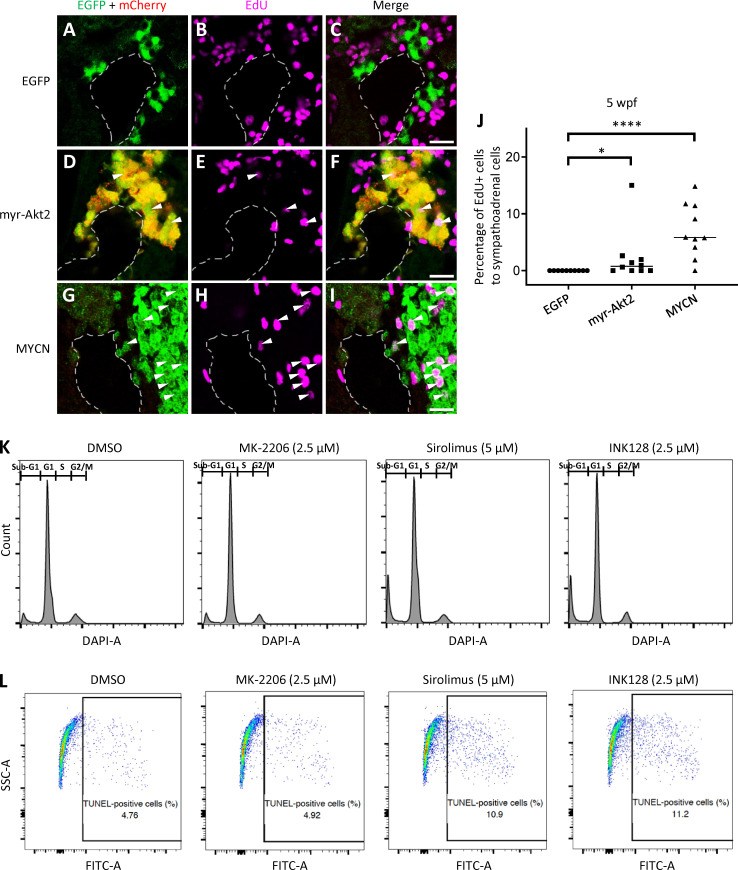
Figure S3.
Cellular phenotype of the sympathoadrenal lineage in the IRG of myr-Akt2 fish and flow cytometry analysis of zebrafish primary ganglioneuroma cells. (A–I) Coimmunostaining of EGFP, mCherry and EdU of the sagittal sections through IRG of EdU-labeled EGFP (A–C), myr-Akt2;EGFP (D–F), and MYCN;EGFP (G–I) transgenic lines at 5 wpf. Arrowheads indicate the EdU-labeled proliferating sympathoadrenal cells. Dotted lines indicate the head kidney (HK) boundary. Scale bar, 20 µm. (J) Percentage of EdU-positive sympathoadrenal cells in the IRG of transgenic fish lines were plotted at 5 wpf. Each symbol represents the value for an individual fish. Horizontal bars indicate medians that were compared with two-tailed Wilcoxon rank-sum test. *, P < 0.05; ****, P < 0.0001. (K and L) Zebrafish primary ganglioneuroma cells were treated with the indicated compound for 48 h. Representative flow cytometric determinations are shown of cell cycle analysis after DAPI staining (K) and apoptotic cell analysis after TUNEL staining (L). Data are representative of three independent experiments.

