Figure 4.
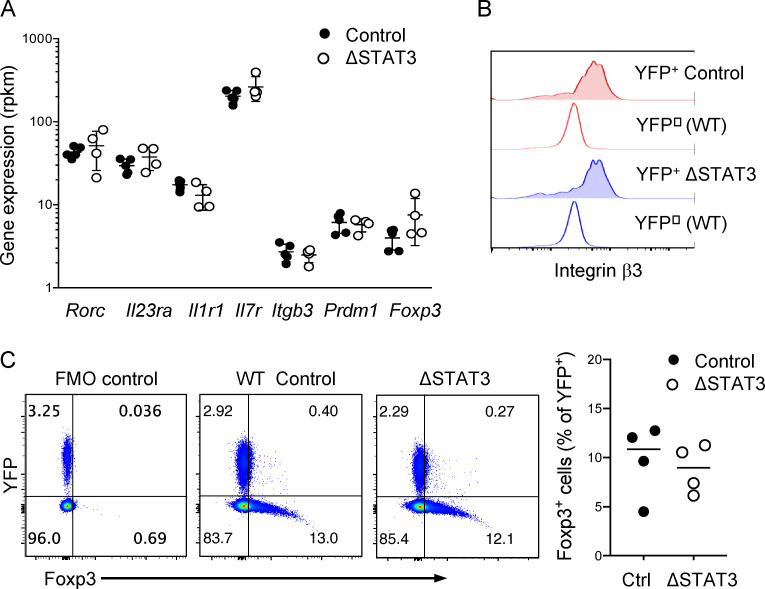
STAT3 deletion in effector Th17 cells does not phenocopy IL-23R blockade. (A) Relative gene expression for select IL-23 targets, generated by RNA sequencing from indicated YFP+ cells sorted from dLNs on day 10 after immunization. (B) Integrin β3 expression analyzed by flow cytometry in YFP+ and YFP− CD4+ dLN cells from Th17ΔSTAT3 and Th17ctrl mice 10 d after immunization with MOG(35–55) in CFA. Plots are representative of three or four mice per group in three experiments. (C) Foxp3 expression in YFP+ cells analyzed by flow cytometry on day 10 after immunization. FMO, fluorescence minus one. Data points show values for individual mice with mean ± SD, pooled from two experiments. Differences between groups were not significant by one-way ANOVA (A) and Student’s t test (C).

