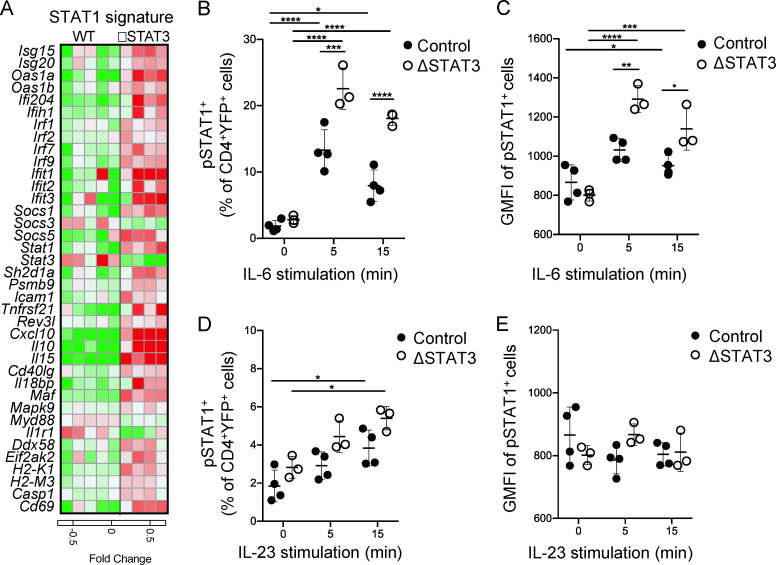
Figure 5.
STAT3 counterregulates STAT1 activation by IL-6 in effector Th17 cells. (A) Heatmap of relative gene expression for known STAT1 targets generated by RNA sequencing from indicated YFP+ cells sorted from dLN on day 10 after immunization. (B–E) dLN cells were isolated from indicated mice on day 10 after immunization with MOG(35–55) in CFA and stimulated with IL-6 (B and C) or IL-23 (D and E) for indicated times. (B and D) Percentage of YFP+ cells expressing pSTAT1. (C and E) Geometric mean fluorescence intensity (GMFI) of pSTAT1-expressing YFP+ cells. Data points show values for individual mice with mean ± SD, pooled from two experiments. *, P < 0.05; **, P < 0.01; ***, P < 0.001; ****, P < 0.0001, one-way ANOVA.

