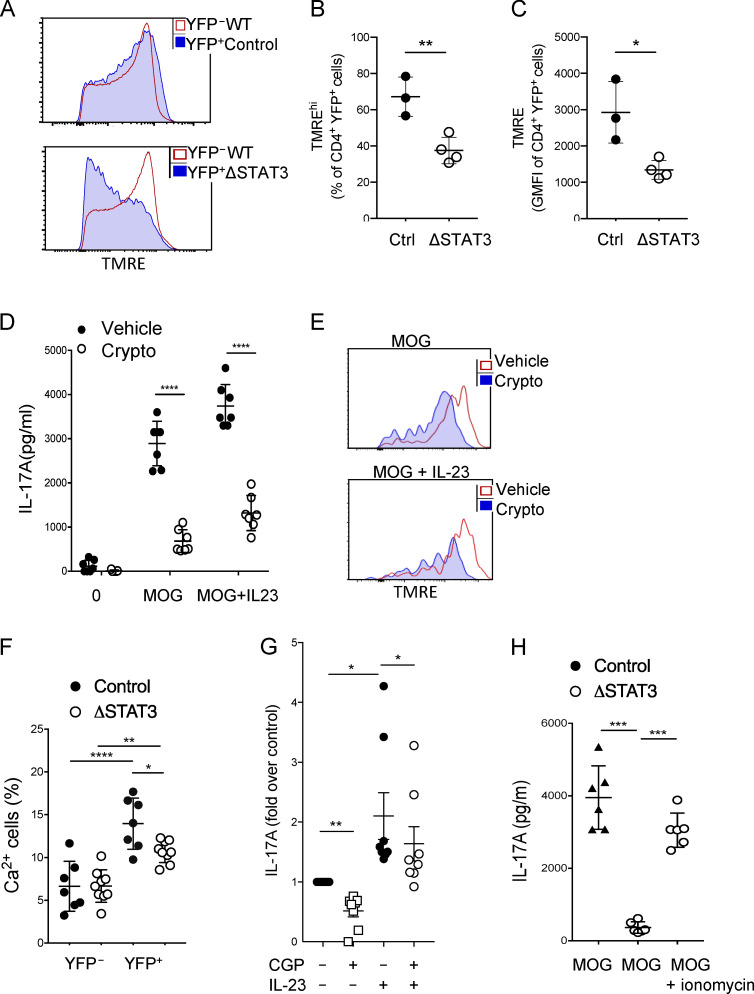
Figure 7.
STAT3 regulates Δψm. (A–C) dLN cells were isolated from indicated mice on day 10 after immunization with MOG(35–55) in CFA and labeled with TMRE for flow cytometric analysis of Δψm. (A) Representative TMRE labeling in YFP+ and YFP– cells from indicated mice. (B) Percentage of cells labeled TMREhi in indicated YFP+ cells. (C) Mean fluorescence intensity of TMRE labeling in YFP+ cells. Data are representative of three experiments with three or four mice per group. (D and E) dLN cells were isolated from Th17ctrl mice on day 10 after immunization with MOG(35–55) in CFA and stimulated with MOG(35–55) in the presence or absence of the STAT3 inhibitor cryptotanshinone for 19 h; IL-17A was assessed in the supernatant by ELISA (D), and TMRE was assessed by flow cytometry (E). Plots are representative of data from two experiments with three mice each. (F) dLN cells were isolated from indicated mice on day 10 after immunization, labeled with the intracellular Ca2+ detector Rhod3-AM, and stimulated with MOG(35–55) for 10 min before flow cytometric analysis. (G) On day 10 after immunization, dLN cells from Th17ctrl mice were stimulated in the presence of MOG ± IL-23 and mitochondrial Ca2+ inhibitor CGP-37157 or vehicle control overnight, and then IL-17 was assessed by ELISA. Data are shown as paired fold change pooled from two experiments. (H) dLN cells were isolated from indicated mice on day 10 after immunization and stimulated with MOG(35–55) with or without ionomycin for 19 h, and IL-17 was assessed by ELISA. Data are pooled from two experiments. *, P < 0.05; **, P < 0.01; ***, P < 0.001; ****, P < 0.0001, Student’s t test (B and C) and one-way ANOVA (D–H).

