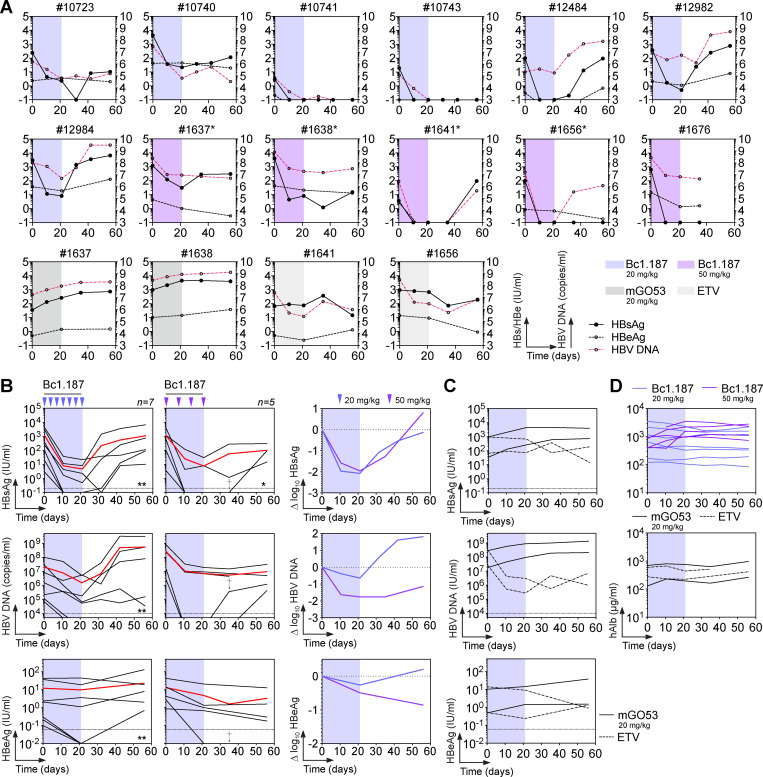
Figure 7.
Bc1.187 antibody therapy in HBV-infected HUHEP mice. (A) Blood HBsAg, HBeAg, and HBV DNA levels over time for each individual HUHEP mouse infected with genotype D HBV, and treated with anti-HBs antibody Bc1.187 for 3 wk with either 20 mg/kg or 50 mg/kg human antibody i.p. Asterisk indicates mice in control groups that were reused for a treatment regimen of Bc1.187 antibody at 50 mg/kg. (B) Evolution of infection over time in HBV-infected HUHEP mice receiving i.p. injections of human anti-HBs antibody Bc1.187 (20 mg/kg ∼0.4 mg every 3–4 d, n = 7; 50 mg/kg ∼1 mg, weekly, n = 5) for 3 wk. Red lines indicate the averages. Dagger (†) and asterisk indicate dead and controlled mice, respectively. The number of asterisks indicates the number of controlled mice. Circulating blood HBsAg, HBeAg, and HBV DNA levels (left) and average Δlog10 values compared with baseline (right, 20 mg/kg, blue lines; 50 mg/kg, purple lines) are shown. (C) Evolution of HBV infection over time in HBV-infected HUHEP mice receiving a treatment with the non-HBV isotype control mGO53 (20 mg/kg i.p.) or Entecavir (ETV) every 3–4 d for 3 wk. Blood levels of HBsAg (black lines), HBeAg (magenta dotted lines), and HBV DNA (black dotted lines) are shown. (D) Graphs showing the levels of human serum albumin over time in infected HUHEP mice and treated i.p. with 20 mg/kg and 50 mg/kg of Bc1.187 antibody as shown in B.

