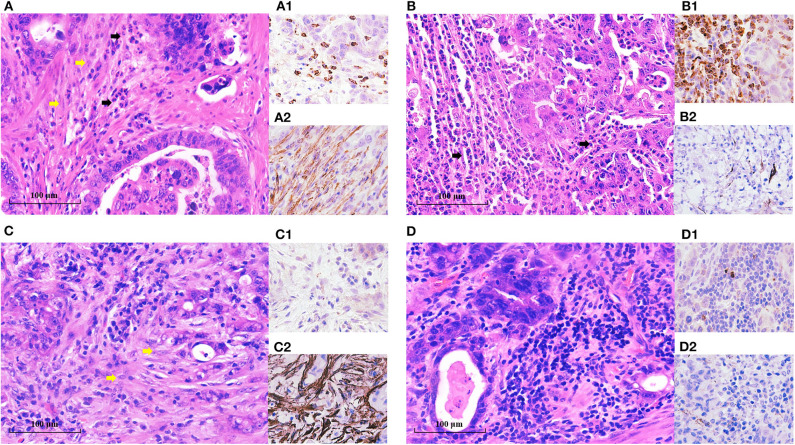
Figure 1.
TANs and CAFs in gastric cancer tissues. TANs and CAFs were detected in the tumor stroma of all these EGC patients by H&E staining and IHC. (A) Both the high-TAN and high-CAF groups: more than 10 TANs per HPF (black arrow) were detected, and CAFs (yellow arrow) accounted for more than 50% of tumor stroma. (B) The high-TAN group with low CAFs: more than 10 TANs per HPF (black arrow) were detected, and CAFs accounted for <50% of tumor stroma. (C) The low-TAN group with high CAFs: <10 TANs per HPF were detected, and CAFs (yellow arrow) accounted for more than 50% of tumor stroma. (D) The low-TAN group with low CAFs: <10 TANs per HPF were detected, and CAFs accounted for <50% of tumor stroma. (A1, B1, C1, D1) TANs using MPO staining. (A2, B2, C2, D2) CAFs using α-SMA staining.

