Abstract
This work examines the filling of Through Silicon Vias (TSV) by Ni deposition from a NiSO4 + NiCl2 + H3BO3 electrolyte containing a branched polyethyleneimine suppressor. Feature filling occurs due to the interaction of transport limited suppressor adsorption and its consumption by potential dependent metal deposition. The interaction between surface topography and suppressor transport yields a sharp transition from passive to active deposition within the TSV. The transition is associated with significant incorporation of the suppressor, or its components, within the Ni deposit that results in grain refinement evident by electron backscatter diffraction (EBSD). Potential waveforms that progressively shift the location of the passive-active transition upward to optimize feature filling were examined. The evolution of feature filling and deposit microstructure are compared to predictions of a three-dimensional model that reflect critical behavior associated with suppressor-derived, S-shaped negative differential resistance (S-NDR). The model uses adsorption and consumption kinetics obtained from voltammetric measurements of the critical potential associated with suppression breakdown. Good agreement between experiment and simulation is demonstrated.
A subset of additive-based electrochemical deposition processes are capable of yielding superconformal deposition for void-free filling of recessed surface features.1,2 However, the relative impacts of transport, adsorption, consumption and surface area on these processes change as the feature size, e.g., trench and via dimensions, varies from deep-sub-micrometer to multi-micrometer dimensions.3–6 Toward the larger end, bottom-up copper electrodeposition in through silicon vias (TSV)7–11 has been proposed to occur through critical phenomena associated with suppression breakdown, as captured by an S-shaped Negative Differential Resistance (S-NDR) mechanism. A key aspect is the nonlinear potential and concentration dependent suppression breakdown that couples with depletion gradients in patterned features to yield highly localized, superconformal deposition. Models incorporating the S-NDR mechanism predict the essential aspects of morphological evolution during bottom-up Cu deposition in TSV.12–14 The highly localized deposition associated with S-NDR is inconsistent with linearized models based on a fixed rate constant for additive depletion.15,16
Prior work has revealed critical behavior in Ni deposition from Watts-type NiSO4 + NiCl2 + H3BO3 electrolytes that contain rate-suppressing additives capable of superconformal filling of sub-micrometer size features, including examples where deposition was restricted to the lower regions of damascene patterned trenches.17–19 Of these additive systems, polyethyleneimine (PEI) has been used to selectively fill or heal microcracks in Ni by electrodeposition20,21 and obtain bottom-up Ni and Ni-alloy,22,23 Co24 and Au25,26 deposition in TSV. Pseudo steady-state, one-dimensional S-NDR models using kinetics obtained from voltammetry on rotating disk electrodes (RDE) capture two key aspects of experimental feature filling for all three metals, namely a transition from suppressed to active deposition partway down the TSV and uniform active deposition below,23–26 behavior that has also been predicted in parametric studies with time dependent 3-D models.13,27 The position of the passive-active transition as a function of suppressor concentration and deposition potential has also been predicted, although the potential dependence was overestimated.23,24
The present study is a more detailed computational examination of TSV filling from the Watts Ni electrolyte-PEI additive system.23 A time dependent 3-D model based on suppressor derived S-NDR is used. The model evaluates the evolution of suppressor and metal ion concentrations within the electrolyte while the adsorbate coverage, interface concentrations and potential define the rate of localized metal deposition. Simulations of feature filling under conditions of applied potential step or potential ramp programs were also examined for comparison to experimental Ni23 (and by analogy, Co24 and Au)26 filling of TSV, that are analogous to galvanodynamic processes reported for filling Cu TSV.28
The microstructure of the Ni deposits in filled TSV, previously examined by scanning electron microscopy (SEM), is reexamined using electron backscatter diffraction (EBSD). The grain size and orientation are characterized and correlated with additive incorporation predicted by the S-NDR model.
Experimental
The TSV filling experiments of interest herein were recently detailed in another publication.23 Electrodeposition was performed using a Watt’s bath comprised of 1 mol/L NiSO4 + 0.2 mol/L NiCl2 + 0.5 mol/L H3BO3, pH = 3.1, with a dilute addition of polyethyleneimine (molecular mass 1800, PEI). The process began with filling of the vias with alcohol to ensure subsequent wetting by the electrolyte. Following immersion of the wetted wafer fragment into the electroplating solution the potential was held at −1.05 V for 20 s to allow mixing of the electrolyte into the alcohol filled features. The wafer fragments, in the form of rectangular specimens, were rotated like helicopter blades about the central contact during the mixing and electroplating process. This geometric configuration results in a slight oscillation of the contribution of ohmic losses as the distance between the tip of the rotating wafer fragment and the reference electrode varies between 1 cm to 3 cm. All potentials are referenced to the mercury-mercurous sulfate-saturated potassium sulfate reference electrode. Additional experimental details can be found in the previous publication.23
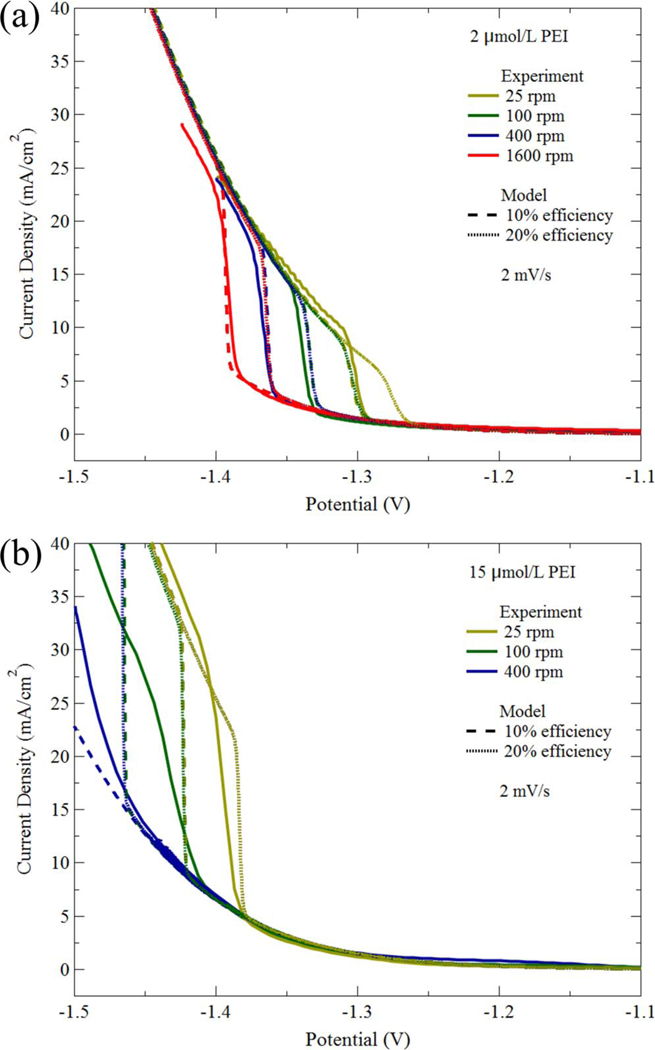
The parameters used in the feature filling simulations are given in Table I. The values are generally the same as those used in the pseudo steady-state 1-D model of the earlier study23 (Table I in that work). One difference is the inclusion of a diffusion coefficient for the metal ion transport that was ignored in the simpler model. Another change is the assumption of 20% current efficiency for Ni deposition on the suppressed surface in place of the 10% used previously; the value of found in Table I, derived from fitting the voltammetry, is therefore 2 × that used to simulate voltammetry in Ref. 23a. The higher value yields a better fit to suppression breakdown potentials observed in electrolyte containing higher PEI concentration that was used in most feature fill experiments. The current efficiency on the active deposit surface is assumed to be 100%, consistent with generally high efficiencies reported for Watts baths operated with a pH at or above 3. The corresponding fit to the voltammograms collected in 2 μ mol/L and 15 μ mol/L PEI is shown in Figure 1. The simulations for 10% deposition efficiency capture the potentials at which suppression breakdown is observed in electrolyte containing 2 μmol/L PEI but overestimate the suppression obtained with 15 μmol/L PEI. Suppression breakdown in the simulations for 20% deposition efficiency is shifted to more positive potentials. This improves agreement with the results in electrolyte containing 15 μmol/L PEI but underestimates the suppression with 2 μmol/L PEI.
Table I.
Values for feature geometry, Ni2+ cation and PEI suppressor concentrations and transport, and the Ni deposition and PEI adsorption/desorption kinetics for the simulations presented in this study. Parameters related to the Ni deposition kinetics and PEI adsorption and consumption are obtained from fitting voltammetric measurements.23
| Parameter | Name | Units | Value |
|---|---|---|---|
| Annular TSV inner radius | Ri | m | 4 × 10⁻⁶ |
| Annular TSV outer radius | Ro | m | 9.5 × 10⁻⁶ |
| Simulation cell radius | Rc | m | 23 × 10−6 |
| TSV height | h | m | 56 × 10−6 |
| Diffusion coefficient, suppressor | DPEI | m2/s | 9.2 × 10⁻¹¹ |
| Diffusion coefficient,29 Ni2+ | DNi | m2/s | 6.6 × 10⁻¹⁰ |
| Bulk concentration, Ni2+ | mol/m3 | 1200 | |
| Boundary layer thickness for rotation rate ω = 200π rad/min (100 rpm) | δ | m | 23 × 10−6 |
| Saturation suppressor coverage | Γ | mol/m2 | 2.5 × 10⁻⁷ |
| Suppressor adsorption kinetics | k+ | m3/mol · s | 1 × 10⁴ |
| Suppressor burial kinetics | k− | 1/m | 3 × 10⁸ |
| Unsuppressed Ni exchange rate constant | A/m2 | 1.3 × 10⁻² | |
| Suppressed Ni exchange rate constant | A/m2 | 5.0 × 10⁻⁴ | |
| Unsuppressed Ni charge transfer coefficient | α0 | - | 0.4 |
| Suppressed Ni charge transfer coefficient | α1 | - | 0.4 |
| Ni ionic charge | n | - | 2 |
| Ni molar volume | Ω | m3/mol | 6.59 × 10⁻⁶ |
Figure 1.
Experiment (solid) and simulated voltammetry for Ni deposition in electrolyte containing the indicated PEI concentrations; the Levich inverse square root dependence of the boundary layer thickness on the rotation rate of the rotating disk electrode is assumed. Details regarding the voltammetry, experiment and simulations are contained in earlier work.23 Simulations are shown both for the parameters found in Table I of this work, corresponding to 20% deposition efficiency on the passivated surface (dot), and the 10% de deposition efficiency used previously23 (dash). Some simulations superimpose because the shift of suppression breakdown due to a 2 × increase of adsorbate consumption arising from the increased deposition current efficiency is identical to that associated with a 4 × decrease of rotation rate (doubling the boundary layer thickness and thus halving the transport limit of the adsorbing suppressor flux).23 Data and simulations are plotted against the applied potential, with cathodic currents positive.
The crystallographic microstructure was investigated by an EBSD system (EDAX Hikari XP EBSD Camerab), equipped with a Schottky-type field emission gun scanning electron microscope (FEI Inspect F50) and associated software. The EBSD maps of the cross-sectioned TSV were obtained at locations over a two-dimensional array with 50 nm pitch. Each scan took approximately 30 min to acquire, and no correction has been made for beam drift during data acquisition over the nominally rectangular region of each scan. As microstructural evolution is not predicted by the S-NDR model, the EBSD experiments permit visualization of grain size and texture and spatial variations thereof within the Ni deposits. Black pixels indicate no crystalline information, i.e., small grain size or highly defected material that yield multiple or weak Kikuchi patterns.
Model and Computational Details
The metal deposition velocity is assumed to be linear in the coverage θ of adsorbate and the local Ni ion concentration CNi in the electrolyte giving
| [1] |
expressed in terms of the metal-related current densities on unsuppressed (j0) and fully suppressed (j1) surfaces at the bulk Ni concentration , where Faraday’s constant F = 96,485 C/mol, n is the ionic charge and Ω is the molar volume. The current densities on both adsorbate-free and fully suppressed surfaces are assumed to exhibit standard overpotential activation kinetics,
| [2] |
where the overpotential η represents the deviation from the reversible potential of ≈ −0.75 V estimated from the cyclic voltammetry. For simplicity, the current contribution of parasitic reactions on the passive surfaces were ignored in the feature filling simulations.
The fractional coverage of suppressor θ on the deposit surface is assumed to evolve through adsorption of suppressor from the electrolyte onto open sites on the evolving surface at a rate proportional to the local concentration CPEI with consumption occurring by burial in the deposit at a rate proportional to the local metal deposition rate
| [3] |
The parameters k+ and k− are kinetic rate constants for adsorption and burial, respectively.
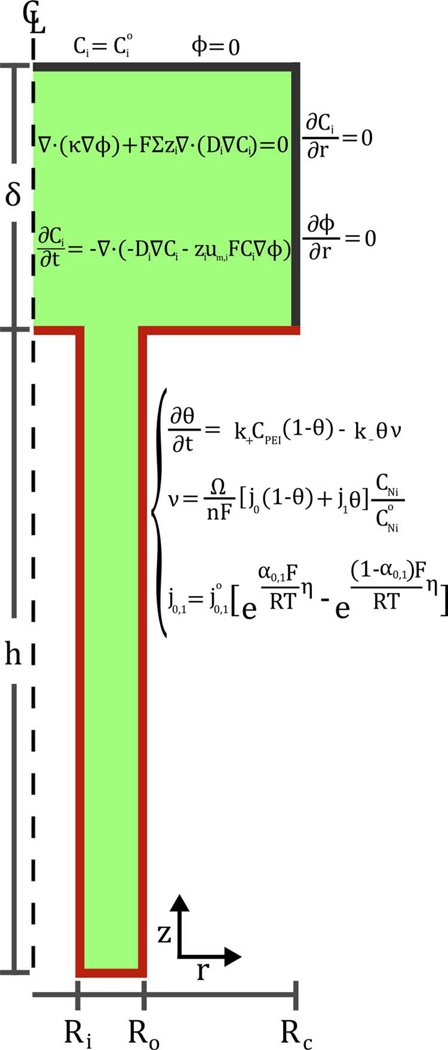
A schematic of a radial slice through the annular TSV and electrolyte, with the equations defining the model overlaid, is shown in Figure 2. As the objective is to gain a physical understanding of the feature filling process the computation domain is simplified with respect to the experimental arrangement. Namely, the electrochemical cell is assumed to be a parallel plate working-counter electrode arrangement, where the counter electrode also serves as the reference electrode, with bulk electrolyte concentrations imposed at the top of the boundary layer and zero flux conditions imposed along the outside radius of the cell. The overpotential η that drives the deposition reaction at the metal/electrolyte interface is referenced to the reversible Nernst potential for the reaction. Technically, the potential applied to the workpiece, EApp, is distributed between the overpotential and the resistive (iR) losses associated with charge transport within the electrolyte, i.e., EApp = η + ϕ + ERev, where ϕ equals the potential change in the electrolyte from the reference electrode to the location on the workpiece and the reversible potential ERev = −0.75 V for this electrolyte.23 For most of the feature filling simulations the potential drop within the electrolyte was made negligible by placing the counter electrode, and thereby the reference point, at the top of the boundary layer whereupon ϕ ≈ 0 in the electrolyte adjacent to entire deposit. This neglect of resistive potential loss is a good approximation for deposition at the smaller overpotentials where the deposition currents are modest. In a subset of simulations, vide infra, the impact of ohmic losses was explored by locating the reference/counter electrode further from the workpiece, from millimeters to centimeters, more in line with the actual experiment.
Figure 2.
Schematic of the annular TSV geometry used in the S-NDR model including the domains of the volume terms and the locations of the surface terms; the subscript i indicates equations for and i = PEI. The domains of the relevant equations, volume and boundary, are noted. The upper surface of the modeled volume corresponds to the top of the boundary layer as well as the planar counter electrode and reference.
Concentration and ionic flux Ni of each species in the electrolyte is defined by the Nernst-Planck equation, such that the evolution of concentration is given by
| [4] |
with charge mobility um,i calculated by the Einstein relation
| [5] |
Ionic migration in the Watt’s electrolyte is approximated by considering a binary electrolyte of 1.2 mol/L Ni2+ and SO42−. The infinite dilution diffusion coefficients of Ni2+ and SO42− differ somewhat, 0.66 × 10⁻⁵ cm2/s versus 1.07 × 10⁻⁵ cm2/s,29 but the diffusivities are taken to be equivalent and equal to the value for Ni2+. The additional charge carriers associated with boric acid and halide in the electrolyte are ignored to avoid the complexity of additional constituent equations. In combination these approximations are expected to overestimate the contribution of electric migration to transport of Ni2+.
Current density j, is associated with the ionic flux through the electrolyte
| [6] |
with electrolyte conductivity κ evaluated according to
| [7] |
Assuming electroneutrality throughout the solution volume,
| [8] |
potential is solved in the electrolyte subject to conservation of charge
| [9] |
where is defined by Eq. 6, resulting in
| [10] |
Local current density at the surface of the deposit, related to η (and thus to ϕ) by Eq. 2, is equated to the Ni2+ flux onto the deposit (surface normal into the boundary) according to
| [11] |
while the zero-flux condition of the ion and suppressor as well as zero-current on the side of the domain are imposed by requiring both
| [12] |
and
| [13] |
Polyethyleneimine, has a pKa of ∼ 10.4, and is expected to be positively charged via protonation in the acidic electrolyte.30 However, due to the uncertainty in PEI charge density, diffusivity and additional parameters, electromigration of suppressor is neglected and its transport solely described by diffusion
| [14] |
As will be seen in many of the feature filling experiments, Ni2+ depletion is negligible at the onset of suppression breakdown and PEI transport to the workpiece by diffusion in the concentrated electrolyte is a good approximation. The normal flux of metal ions onto the surface and the local Ni deposition rate are related by
| [15] |
where v depends on local conditions through Eq. 1. Zero-flux of sulfate ion onto the electrode surface is further imposed by
| [16] |
With the suppressor incorporation in Eq. 3 also already defined through v, only the flux of suppressor in the electrolyte adjacent to the deposit surface and the rate of additive adsorption remain to be equated according to
| [17] |
for saturation coverage Γ. Contributions by electromigration to potential variation and ionic transport through the electrolyte are expected to be small due to the minimal Ni2+ depletion across the evaluated parameter set. For comparison, results neglecting electromigration and defining potential variation by Laplace’s equation are included in the supplementary materials.
The full system of equations was solved numerically using a finite element method (FEM) analysis. The model was implemented in the COMSOL software package, the code for the axisymmetric geometry imposing mass conservation at r = 0 automatically. To emulate experimental conditions, namely immersion of ethanol wetted wafer fragments, the initial concentrations of both metal ion and suppressor were zero throughout the volume of the TSV and boundary layer. The simulations also implement a 20 s hold at 1.05 V prior to stepping to the deposition potential of interest, except where specified otherwise. Selective mesh refinement in the regions of highest gradient (within the TSV) was used to reduce the computational burden while still ensuring model accuracy. Deposition profiles and associated concentration contours as well as maps of suppressor incorporation were obtained using triangular mesh nodes in the refined regions of less than 0.2 μm on a side. The simulations contained approximately 8,000 total mesh elements, and the overall charge balance error (the fractional difference between the total integrated currents at the counter electrode and the substrate) was less than 0.01%. Progress in the time dependent simulations would halt when deforming mesh nodes within the TSV became too distorted. In these cases, simulations were re-meshed and then continued from the prior stop point. When side-wall impingement occurred within the TSV leading to a seam or void the simulations were stopped. The simulations using stepped or ramped potential waveforms, shown later in this work, involved three re-meshings. All simulations were performed on a Dell Optiplex 980 desktop computer with an Intel Core i5 CPU@ 3.20 GHz and 8 GB RAM using a Windows 7 Enterprise 64-bit operating system. FEM simulations were performed using COMSOL version 5.3 software with the electrodeposition module coupling surface reactions, tertiary current distribution, and deformed geometry modules. Simulations took on the order of tens of minutes to a few hours depending on the complexity of the potential waveform and duration of deposition evaluated.
Fixed Potential Deposition in TSV
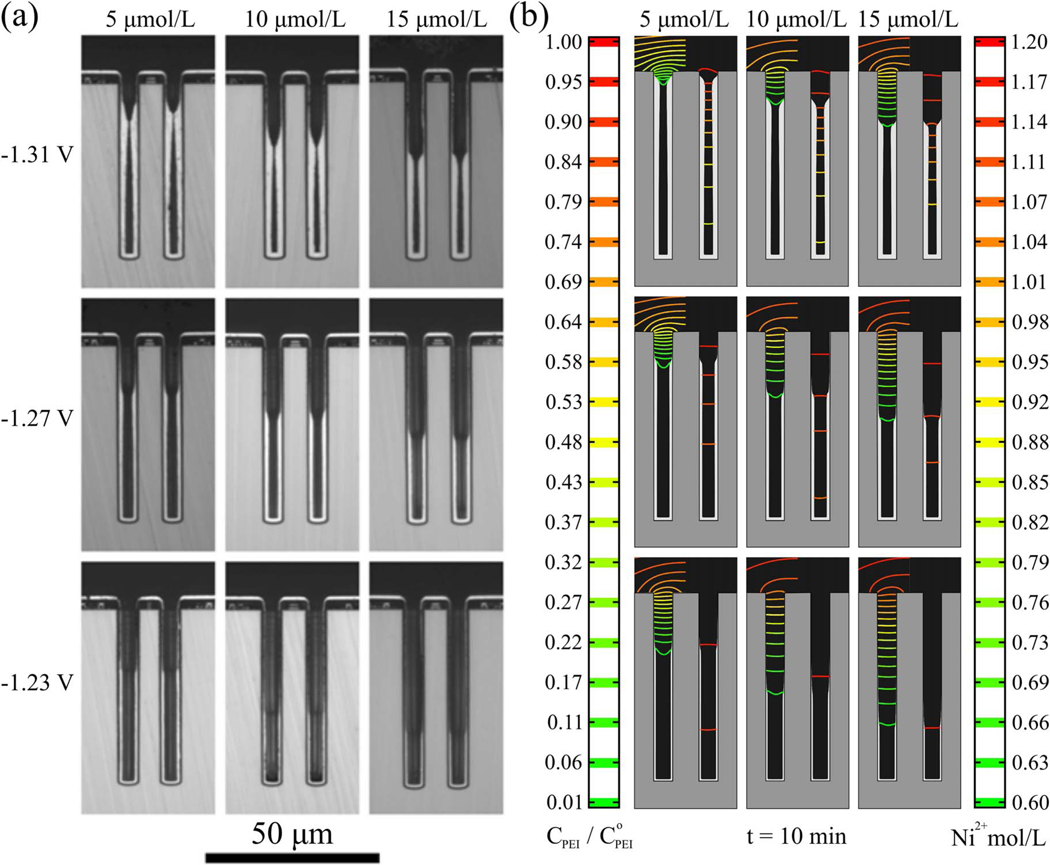
TSV that were cross-sectioned following 10 min of Ni deposition at the indicated suppressor concentrations and applied potentials are shown in Figure 3a. The transition from passive to active Ni deposition is evident along the sidewalls of the TSV, the domain (or region) of active Ni deposition being more limited at less negative potential and higher suppressor concentration. The simulations in Fig. 3b qualitatively capture the experimental observations: the passive-active transition along the sidewalls and the trends of its position with potential and suppressor concentration. Significantly, the suppressor concentration (shown scaled to the bulk concentration in the left half of each simulation) approaches zero at the location of the passive-active transition. The sagging of the bottommost suppressor isoconcentration contour (concave up), located at the transition, aims the gradient that is normal to the contour, and thus the flux of suppressor, at the growth fronts on the sidewalls. This indicates transport limited suppressor incorporation at this location. In contrast, the middle of the metal ion isoconcentration contour (right half of each simulation) is concave down in the same location, clearest at the most negative potential, focusing metal flux past this region. This indicates charge transfer limited metal deposition, rather than transport limited, occurs on the adjacent surfaces, consistent with Ni2+ concentration exceeding 75% of the bulk value at the very bottom of the TSV for all simulated conditions.
Figure 3.
a) Cross-sectioned annular TSVs after 20 s idle at −1.05 V followed by 10 minutes of Ni deposition, substrate rotation rate 100 rpm, for the indicated PEI concentrations and overpotentials. (Fig. 3 of Ref. 23). b) Simulations from the S-NDR model for the experimental conditions and other parameters from Table I. Isocontours of suppressor concentration, scaled by the bulk concentration, and metal ion concentration are overlaid on the unfilled volume of the TSV on the left and right sides, respectively, of each simulation. Color scales are shown on the two corresponding sides of the simulations.
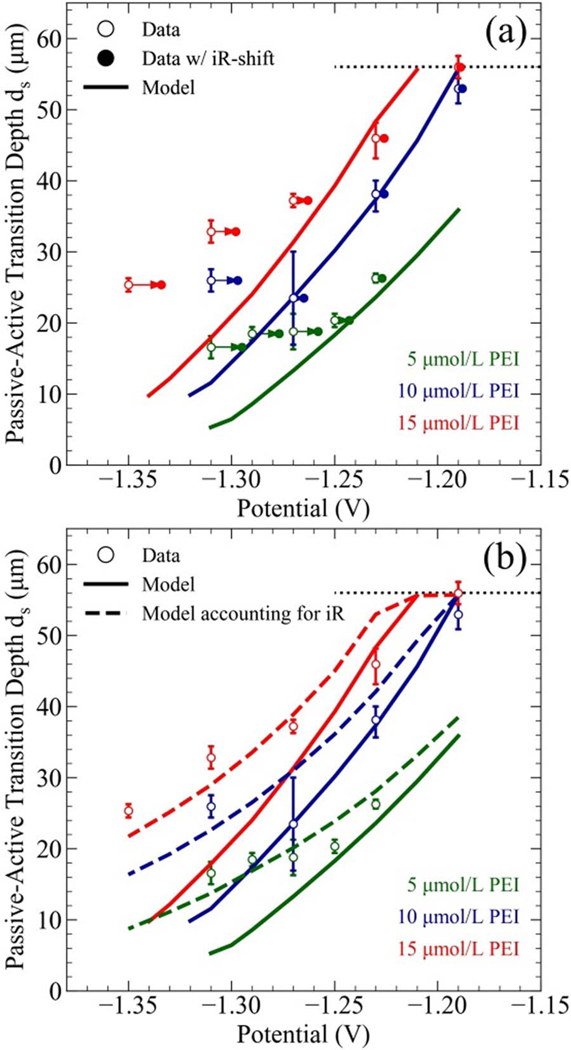
The passive-active transition is characterized by its depth within the TSV. Specifically, the experimental distance ds represents the distance from the field to the location where the maximum Ni deposition rate is achieved. Comparison of the experimental data with the predictions of the S-NDR model is shown in Figure 4. The simulations capture the experimental trends although, as with the prior 1-D simulations,23 the 3-D simulations overestimate the potential dependence. This likely results from ignoring ohmic losses in the electrolyte. Accounting for the experimentally measured iR-drop, as shown in Figure 4a, shifts the data into better agreement with the S-NDR model. Alternatively, the effect of iR losses can be probed computationally by moving the reference/counter electrodes to a position beyond the hydrodyanamic boundary, δ, shown in Figure 2. Using the idealized geometry, Figure 4b shows predicted passive-active transition depths accounting for iR loss using a solution conductivity calculated by Eq. 7 (23.8 S/m in the bulk electrolyte), cross-sectional area of πRc2 and a distance of 1 cm between the TSV field and counter/reference electrode. Agreement with the slope in the experimental data is significantly improved. A more robust assessment of the ohmic losses associated with the actual experiment would require solving for the more complicated experimental geometry that is beyond the objective of the present work.
Figure 4.
Summary of experimental values and model predictions for the indicated PEI concentrations as functions of applied potential: the maximum and minimum experimental values (○) are given for the distance ds measured from the TSV field to where the deposit was thickest along with the corresponding distance in S-NDR model simulations (—). a) Post-experimental correction for iR shift (●) was determined from experimentally measured deposition currents and cell resistance. b) Simulations including iR effects for an idealized geometry (—) shift the S-NDR model into better agreement with experimental observations. The dashed black line indicates the bottom of the TSV.
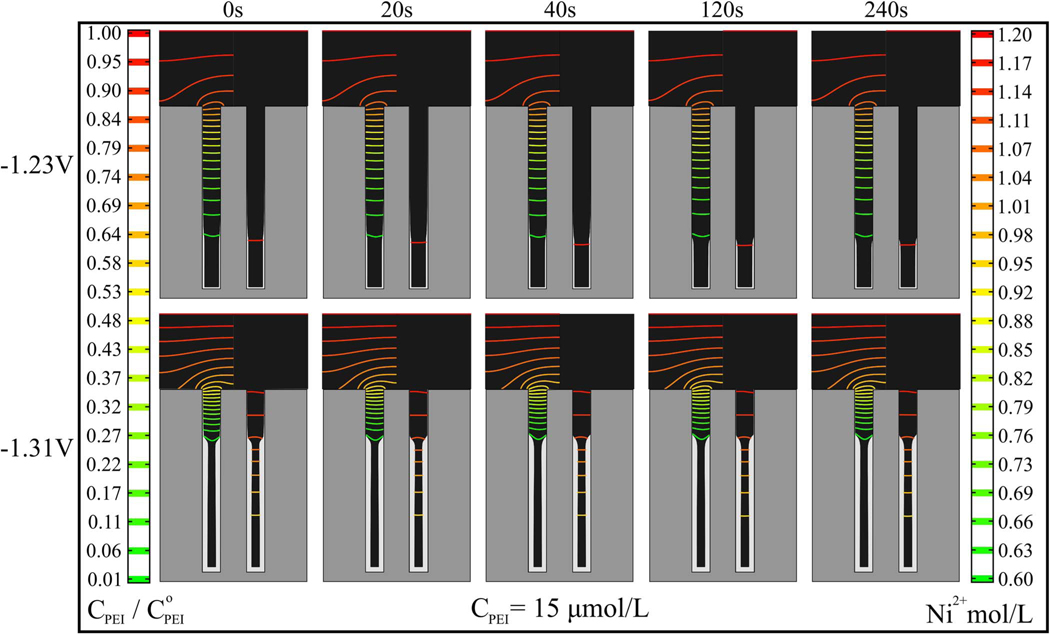
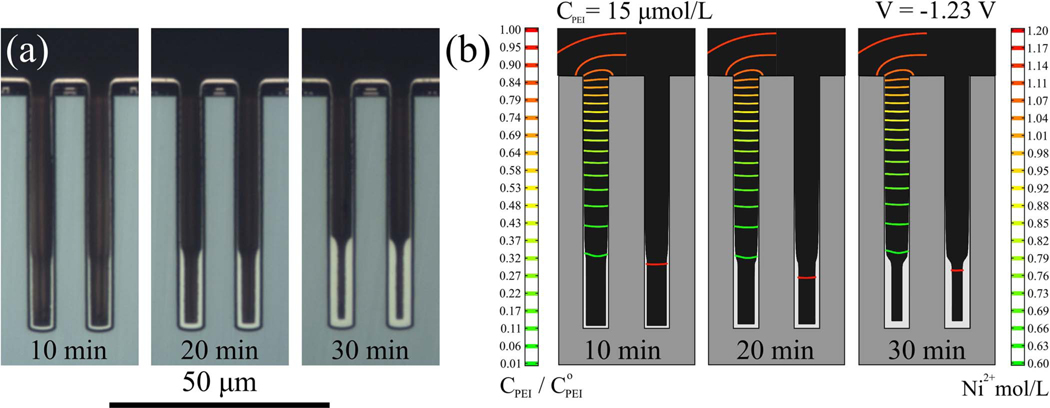
The effect of variation in the initial conditions, namely the mixing of the electrolyte and the ethanol initially in the TSV, on subsequent Ni deposition at −1.23 V and −1.31 V was explored as shown in Figure 5. The simulations indicate that the duration of the idle step does not affect the occurrence of the passive-active transition along the TSV sidewall and causes only a slight shift in the position of the transition. Experiment and simulation also support the broader statement that the passive-active profile is essentially steady-state in nature, reflecting the suppressor depletion gradient needed to balance potential-dependent incorporation in the deposit, whence the location of the transition remains fixed over 30 min of Ni deposition as shown in Figure 6. The non-transient nature of the deposition profile is consistent with the results in Fig. 5 and explains the efficacy of the 1-D pseudo steady state model used in the earlier analysis.23
Figure 5.
Simulations from the S-NDR model for the indicated time at the idle potential of −1.05 V followed by 10 min of Ni deposition at −1.23V or −1.31V, suppressor concentration 15 μmol/L and other parameters from Table I. Isocontours of suppressor concentration, scaled by the bulk concentration, and metal ion concentration are overlaid on the unfilled volume of the TSV on the left and right sides, respectively, of each simulation. Scale bars are shown on the corresponding sides of the figure.
Figure 6.
a) Ni deposition at −1.23 V for the indicated deposition times in electrolyte containing 15 μmol/L PEI. b) Simulations for the same deposition times and conditions, other parameters from Table I. Isocontours of suppressor concentration, scaled by the bulk concentration, and metal ion concentration are overlaid on the unfilled volume of the TSV on the left and right sides, respectively, of each simulation. Scale bars are shown on the corresponding sides of the figure.
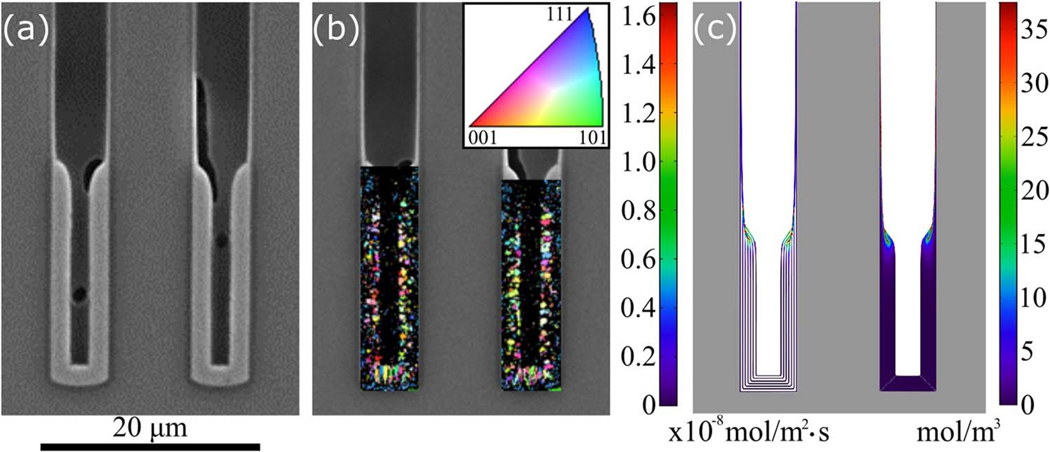
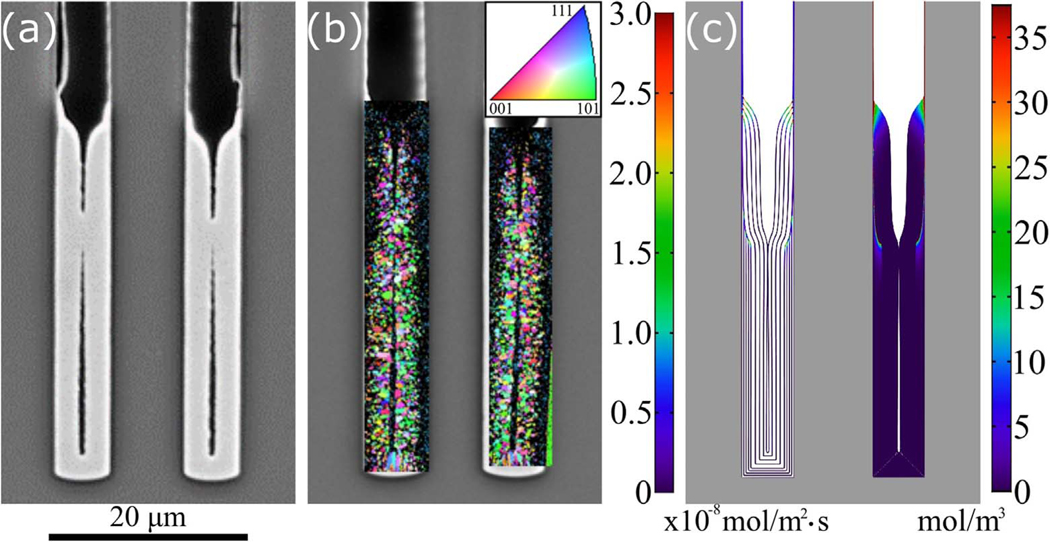
The 1-D model predicted substantial suppressor incorporation through the consumption term k_vθ (Eq. 3) only within the passive-active transition zone and the much thinner deposits on the passive surfaces higher in the TSV.23 The decreased grain size in the Ni deposit within the transition zone noted in scanning electron microscope images was ascribed to the suppressor breakdown products included as impurities. The Ni deposit imaged by SEM in Figure 7a is mapped using EBSD to determine the grain size and grain orientation normal to the TSV sidewalls, i.e., the growth direction, in Fig. 7b. Typical of many forms of thin film growth, the grain size increased as the deposit thickened, yielding larger grains farther from the sidewalls. The relatively large, columnar grains starting immediately adjacent to the TSV bottom suggest epitaxial growth on the larger grains that are expected, for the same reason, in the thicker Cu seed layer. At the passive-active transition zone the map is dark, indicating grains are too small to resolve (or with degraded crystallinity), congruent with the simulation in Fig. 7c that predict the higher additive consumption rate (left-hand via) and higher additive incorporation (right-hand via) at this location. The highest PEI incorporation levels are along the passivated sidewalls, approaching 75 mol/m3 in the adjacent deposits; the PEI concentration color map saturates at half of this maximum value to improve visualization of interior regions with somewhat lower impurity levels.
Figure 7.
a) Scanning electron microscope image of the lower portion of a TSV after deposition for 30 min at −1.23 V in electrolyte containing 15 μmol/L PEI. b) The microstructure characterized using electron backscatter diffraction. The map is darker in the uppermost region (where the deposition transitions from passive to active) indicating grain size below the resolution of the measurement or degraded crystallinity. The color map indicates the grain orientation normal to the TSV sidewalls. c) S-NDR model prediction of suppressor incorporation in the Ni deposit for the same conditions, other parameters from Table I. The left side shows the rate of PEI incorporation (Eq. 3, Γk_vθ) on contours of the growth surface at 5 min intervals of deposition; the right side shows a map of the resulting PEI concentration in the deposit. The diagonal white lines emanating from the bottom corners are artifacts of plotting.
A (100) growth texture has been reported for Ni deposition from additive-free Watts electrolyte at these potentials, while a (110) growth texture was observed at more negative potentials, over a broad pH range.31 The EBSD map in Fig. 7b for the present deposits does not exhibit substantial texture in the Ni below the transition zone where the electrolyte is essentially suppressor-free. The absence of texture may reflect the impact of the seed-layer, the limited thickness of the deposit as well as the nonplanar nature of the annular via geometry.
Potential Mediated Filling Of TSV
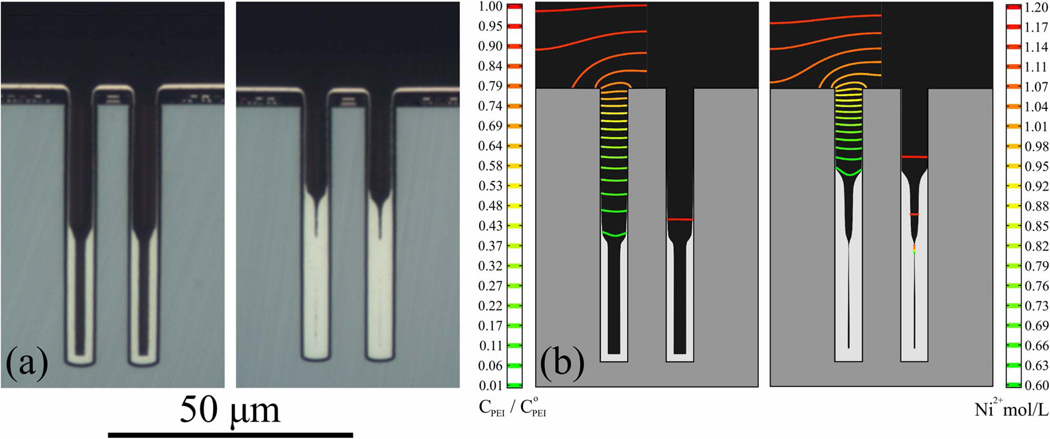
In contrast to some S-NDR Cu systems,7 deposition at fixed potential does not yield complete filling of TSV in this S-NDR Ni system. In pursuit of feature filling, the use of stepped and ramped potential programs to progressively move the passive-active transition up the TSV was previously explored23 as suggested by the behavior in Fig. 3. Alternatively, a multistep galvanodynamic program might serve as a practical alternative, as detailed for Cu.28 A demonstration of the principle is shown in Figure 8a using a simple potential step waveform: deposition at −1.23 V (20 min) followed by deposition at −1.27 V (20 min). The upward translation of the passive-active transition anticipated upon application of the more negative potential leaves a tell-tale step in the optical image of the growth contour. Simulations shown in Fig. 8b capture the displacement of the active-passive transition that accompanies the potential change. The contours of suppressor concentration (left side of each simulation) make clear the increased gradient (i.e. compressed isocontour lines) associated with the transport limited suppressor incorporation as the passive-active transition shifts upward. The Ni2+ ion depletion (right side of each simulation) becomes more significant as the aspect ratio of the unfilled region increases below the constriction.
Figure 8.
Cross-sectioned annular TSV after Ni deposition in electrolyte containing 10 μmol/L PEI for a) 30 min at −1.23 V versus 20 min at −1.23 V then 20 min at −1.27 V. A narrow void is barely evident in the lower portion of the TSV after deposition at the two potentials. b) Simulations for the same deposition times
The SEM image in Figure 9a captures the narrow center void in the lower portion of the TSV more clearly than the optical image in Fig. 8a. The EBSD map in Fig. 9b shows the grain size and grain orientation normal to the TSV sidewalls throughout the Ni deposit. Darker regions indicating reduced grain size or degraded crystallinity are seen both at the transition zone and farther down, adjacent to the sidewall where the deposit bridges. The suppressor incorporation predicted by the S-NDR model is shown in Fig. 9c. Two regions of significant additive incorporation are predicted by the model in association with the potential step program, namely at the top of the deposit (the passive-active transition at −1.27 V) and adjacent to the sidewall where the deposits bridge (the passive-active transition at −1.23 V, left side of Fig. 8a). With negligible suppressor reaching the electrolyte below the passive-active transition, additive-free Ni deposited at −1.27 V is predicted to cover the impurity rich transition zone from −1.23 V; the regions of elevated PEI incorporation in the simulation are coincident with the regions of degraded microstructure in the EBSD map. In this particular example, a preferential (110) growth orientation is seen in the surrounding, impurity-free deposits (green, EBSD map).
Figure 9.
a) Scanning electron microscope image of a cross-sectioned annular TSV after Ni deposition in electrolyte containing 10 μmol/L PEI for 20 min at −1.23 V then 20 min at −1.27 V. The image is from the same specimen as Fig. 8 but has been cropped to focus on the Ni deposit. b) The microstructure of the TSV characterized using electron backscatter diffraction. The texture map corresponds to the grain orientation normal to the TSV sidewalls. Dark regions indicating decreased grain size or degraded crystallinity are visible at the top of the metal deposit and adjacent to the deposit bridging the central void. Tilt of the void in the lower region and misaligned scan area in the righthand map result from beam drift during the scan. c) Simulation of additive incorporation in the Ni deposit for the experimental growth conditions, with other parameters from Table I. The left side shows the rate of PEI incorporation (Eq. 3, Γk_vθ) on growth contours at 5 min intervals; the right side shows a map of the resulting PEI concentration in the deposit. The color scale saturates at roughly half the maximum predicted value, found only in the passive deposits lining the upper sidewalls. The regions of elevated PEI incorporation exhibit reduced grain size in the EBSD map. The diagonal white lines emanating from the bottom corners are artifacts of plotting.
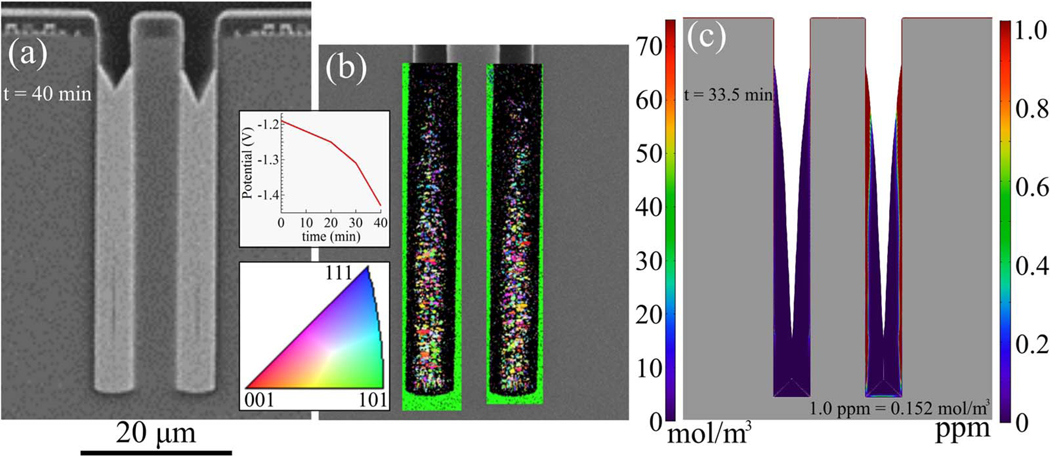
TSV filling obtained using a time-dependent potential ramp from −1.19 V to −1.43 V is shown in the SEM image in Figure 10a; a narrow void along the center line in the lower region of the via is just visible. An EBSD map of the grain size and orientation normal to the TSV sidewalls is shown in Fig. 10b. The grain size decreases or crystallinity degrades toward the top of the deposit in an increasingly wide region adjacent to the sidewalls. As with the specimen examined in Fig. 7, there is no obvious preferred orientation. The simulation in Fig. 10c, although not showing complete filling due to the computation terminating upon sidewall impingement at −1.35 V (vs deposition through −1.43 V in the experiment), indicates suppressor incorporation with the impurity level exceeding 1 ppm in the same region. The observed evolution results from the higher suppressor flux implicit in the steeper suppressor gradient as the passive-active transition moves higher in the TSV (e.g., see Fig. 8); faster metal deposition at the more negative potentials also associated with the upward shift of active deposition evidently does not fully compensate.
Figure 10.
a) SEM image of cross-sectioned annular TSV after Ni deposition in electrolyte containing 15 μmol/L PEI for a potential ramp from −1.19 V to −1.43 V, the ramp rate 0.05 mV/s through −1.25 V, then 0.1 mV/s through −1.31 V and then 0.2 mV/s through −1.43 V. b) The microstructure characterized using electron backscatter diffraction. The texture map corresponds to the grain orientation normal to the TSV sidewalls. Grain size decreases toward the upper region. c) S-NDR model prediction of additive incorporation in the Ni deposit. Deposition is simulated for the potential ramp to −1.35 V (imminent sidewall impingement approximately 8 μm from the TSV bottom halted the simulation), other parameters from Table I. Incorporation is shown full scale on the left side; the highest impurity concentrations are limited to extremely narrow regions along the sidewall. A limited range capturing concentrations of order 10−6 mole PEI per mole Ni (ppm) is shown on the right side. Scale bars are shown on the corresponding sides of the figure. Although filling is not fully captured due to the restricted potential range, the regions of ppm (and greater) PEI incorporation are clearly coincident with reduced grain size in the EBSD. Spatial oscillations evident at high magnification and the diagonal white lines emanating from the bottom corners are artifacts of the 0.2 μm mesh and plotting, respectively.
Discussion
The sharp breakdown of inhibition evident in voltammetric curves for S-NDR suppressor-electrolyte systems reflects a two-state active– passive system. In S-NDR models for PEI-containing Ni,23 Co24 and Au26 electrolytes that assume suppressor consumption through burial, suppression breakdown occurs when the transport-limited rate of suppressor adsorption from the electrolyte equals the rate at which the adsorbed suppressor is consumed by potential-dependent metal deposition. For recessed features such as TSV, the decrease of suppressor concentration within the feature introduces a position-dependent shift of the effective “critical potential” toward more positive values compared to that of the free-surface. The deposit in the actively plated region of the TSV, uniformly thick and essentially independent of suppressor concentration, reflects the active state of the bifurcated system.
The combination of EBSD and a fully 3-D, time-dependent S-NDR model support this mechanism of feature filling in this Ni-PEI electrolyte. Predictions of the more detailed model shown here confirm that simplifications in the pseudo steady state 1-D analysis capture the essential physics and remain qualitatively correct. The simulations, particularly those examining idle steps of varying duration, show that the filling profile is not significantly affected by transient conditions associated with immersion and application of potential control. However, like the simpler 1-D model, the predictions neglecting iR losses overestimate the impact of applied potential on suppression break-down (Fig. 4). However, accounting for iR contribution through both experimental and theoretical approaches demonstrates improved correlation between TSV transition depths and S-NDR model predictions.
The fixed location of the passive-active transition along the side-wall observed in Fig. 6 and predicted invariance with initial conditions indicated in Fig. 5 are entirely different from the behavior observed for different idle times prior to Cu deposition in an S-NDR Cu system.32 In that case, a passive-active transition along the sidewall analogous to that obtained in this Ni S-NDR system was also evident after deposition that followed an idle step. However, as the idle time was increased the transition from passive to active deposition moved significantly farther down the TSV and the deposit became thinner. Furthermore, deposition transitioned within 4 min to either bottom-up filling or complete passivation, depending on the deposition potential. Unlike with the S-NDR Ni system (and the Co24 and Au25,26 S-NDR systems), the passive-active transition on the sidewall was clearly only transitional with the co-adsorbate based Cu system, presumably linked to initial transport of the dilute additive(s) down the relatively tall feature.
The correlation of grain refinement in the passive-active transition zone, imaged by EBSD, and prediction of enhanced additive incorporation support the physical picture of additive deactivation by incorporation that underlies S-NDR models of Ni, as well as Co and Au, filling of TSV. This understanding enables improved control of both feature filling and deposit microstructure from such S-NDR systems. While less well studied than the bottom-up deposition that is generally the topic of exploration in Cu filling, this variant of S-NDR superconformal deposition permits well controlled filling across arrays of features.23,24
Conclusions
The present exploration expands upon previous studies using a Watts-based Ni electrolyte containing dilute PEI that yields localized, superconformal deposition in features. The essential features of TSV filling are well predicted by the time-dependent 3-D S-NDR model, supporting use of a pseudo steady state 1-D model in a previous study to obtain kinetics from the observed critical system behavior. Spatial variation of the deposit microstructure characterized by electron backscatter diffraction is found to be consistent with the effects of additive incorporation for several different growth conditions. The effectiveness of S-NDR models of suppressor derived critical phenomena for generating quantitative prediction of superconformal filling of recessed surface features such as TSV has been demonstrated. Furthermore, the model enables prediction of the location and quantity of suppressor incorporation into the deposits that supports the observed grain refinement, thereby providing an additional link between electroanalytical measurements and the deposit microstructure.
Supplementary Material
Acknowledgments
Research by S.-H. Kim and H.-J. Lee was supported by the Basic Science Research Program through the National Research Foundation of Korea (NRF) funded by the Ministry of Education (NRF-2016R1D1A1B02015781). T.M.B acknowledges support from the National Institute of Standards and Technology National Research Council Postdoctoral Fellowship Program.
Footnotes
The values of both and used in all simulations in Ref. 23 are the numerical values in Table I of that work but with units of mA/cm2, not A/m2 as labeled. The correct values are thus 10× the values stated therein.
Identification of commercial products in this paperwas done to specify the computational methods. In no case does this imply endorsement or recommendation by NIST.
References
- 1.Andricacos PC, Uzoh C, Dukovic JO, Horkans J, and Deligianni H, IBM J. Res. Dev, 42, 567 (1998). [Google Scholar]
- 2.Moffat TP, Wheeler D, Edelstein M, and Josell D, IBM J. Res. Dev, 49, 19 (2005). [Google Scholar]
- 3.Moffat TP, Wheeler D, and Josell D, “Superconformal Film Growth”, in Advances in Electrochemical Science and Engineering, eds. Alkire RC, Kolb DM, Lipkowski J, and Ross PN, Vol. 10, pg. 107 Wiley-VCH; (2005). [Google Scholar]
- 4.Josell D, Beauchamp CR, Kelley DR, Witt CA, and Moffat TP, Electrochem. Solid-State Lett, 8, C54 (2005). [Google Scholar]
- 5.Josell D, Wheeler D, and Moffat TP, J. Electrochem. Soc, 153, C11 (2006). [Google Scholar]
- 6.Josell D. and Moffat TP, J. Electrochem. Soc, 160, D3009 (2013). [PMC free article] [PubMed] [Google Scholar]
- 7.Moffat TP and Josell D, J. Electrochem. Soc, 159, D208 (2012). [PMC free article] [PubMed] [Google Scholar]
- 8.Wang S. and Lee SWR, Proceedings ASME 2011 International Mechanical Engineering Congress & Exposition (IMECE2011), November 11–17, 2011, Denver, Colorado, pp. 855 (2011). [Google Scholar]
- 9.Kim MJ, Kim HC, Choe S, Cho JY, Lee D, Jung I, Cho WS, and Kim JJ, J. Electrochem. Soc, 160, D3221 (2013). [Google Scholar]
- 10.Hayase M. and Nagao M, J. Electrochem. Soc, 160, D3216 (2013). [Google Scholar]
- 11.Jin SY, Wang G, and Yoo BY, J. Electrochem. Soc, 160, D3300 (2013). [Google Scholar]
- 12.Josell D, Wheeler D, and Moffat TP, J. Electrochem. Soc, 159, D570 (2012). [Google Scholar]
- 13.Wheeler D, Moffat TP, and Josell D, J. Electrochem. Soc, 160, D3260 (2013). [Google Scholar]
- 14.Yang L, Radisic A, Deconinck J, and Vereecken PM, J. Electrochem. Soc, 160, D3051 (2013). [Google Scholar]
- 15.Madore C, Matlosz M, and Landolt D, J. Electrochem. Soc, 143, 3927 (1996). [Google Scholar]
- 16.West AC, J. Electrochem. Soc, 147, 227 (2000). [Google Scholar]
- 17.Kim S-K, Bonevich JE, Josell D, and Moffat TP, J. Electrochem. Soc, 154, D443 (2007). [Google Scholar]
- 18.Lee CH, Bonevich JE, Davies JE, and Moffat TP, J. Electrochem. Soc, 155, D499 (2008). [Google Scholar]
- 19.Lee CH, Bonevich JE, Davies JE, and Moffat TP, J. Electrochem. Soc, 156, D301 (2009). [Google Scholar]
- 20.Zheng XG, Shi YN, and Lu K, J. Electrochem. Soc, 160, D289 (2013). [Google Scholar]
- 21.Zheng XG, Shi YN, and Lu K, J. Electrochem. Soc, 162, D222 (2015). [Google Scholar]
- 22.Lin YT, Huang HM, Wang HW, Dow WP, Lin JY, Chang PH, and Lee HC, ECS Electrochem. Lett, 4, D25 (2015). [Google Scholar]
- 23.Josell D. and Moffat TP, J. Electrochem. Soc, 163, D322 (2016). [PMC free article] [PubMed] [Google Scholar]
- 24.Josell D, Silva M, and Moffat TP, J. Electrochem. Soc, 163, D809 (2016). [Google Scholar]
- 25.Josell D. and Moffat TP, J. Electrochem. Soc, 160, D3035 (2013). [PMC free article] [PubMed] [Google Scholar]
- 26.Josell D. and Moffat TP, J. Electrochem. Soc, 164, D327 (2017). [DOI] [PMC free article] [PubMed] [Google Scholar]
- 27.Wang Y, Zhu W, Li X, and Wang F, Electrochim. Acta, 221, 70 (2016). [Google Scholar]
- 28.Yang L, Radisic A, Deconinck J, and Vereecken P, J. Electrochem. Soc, 162, D599 (2015). [Google Scholar]
- 29.Vanysek P, Ionic Conductivity and Diffusion at Infinite Dilusion. In CRC Handbook of Chemistry and Physics, 97th ed; Haynes WM, Ed., CRC Press/Taylor and Francis: Boca Raton, FL, Internet Version 2017. [Google Scholar]
- 30.Mészáros R, Thompson L, Bos M, and de Groot P, Langmuir, 18, 6164 (2002). [Google Scholar]
- 31.Motoyama M, Fukunaka Y, Sakka T, and Ogata YH, J. Electrochem. Soc, 153, C502 (2006). [Google Scholar]
- 32.Josell D. and Moffat TP, J. Electrochem. Soc, 165, D23 (2018). [PMC free article] [PubMed] [Google Scholar]
Associated Data
This section collects any data citations, data availability statements, or supplementary materials included in this article.


