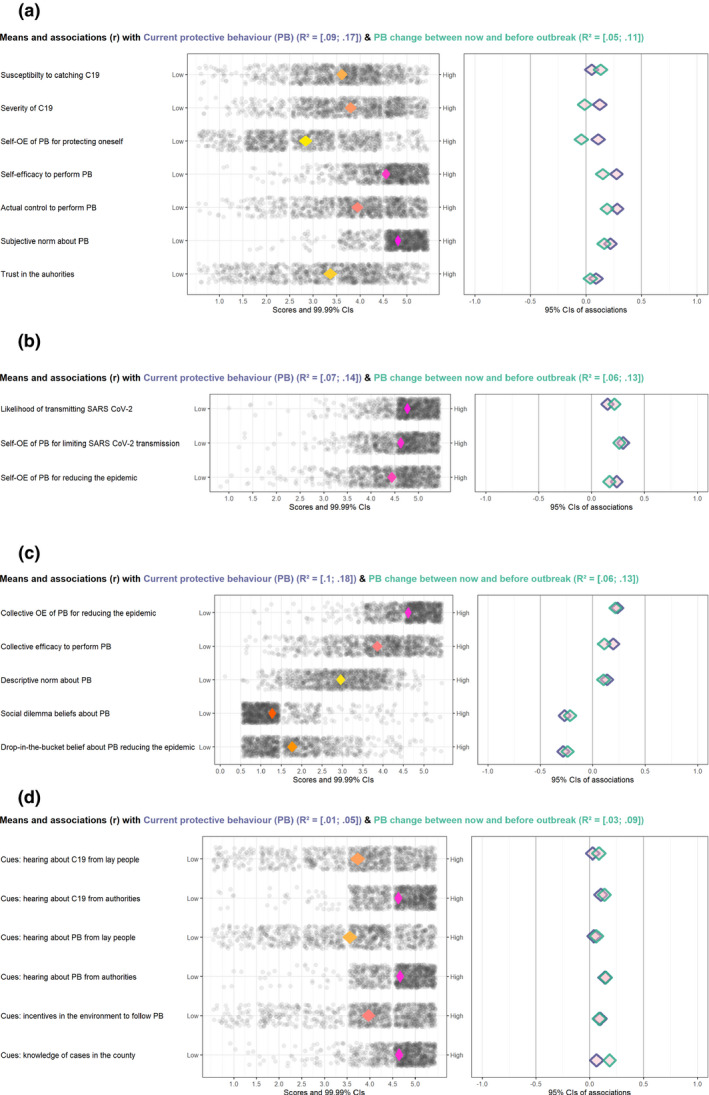
FIGURE 3.

a. CIBER plots of means and associations (r) of beliefs towards COVID‐19 with adoption of. protective behaviours. Legend: In the right‐hand graphs, purple diamonds represent the score of current protective behaviour, and green diamonds represent the score of change between now and before outbreak. Figure 3b. CIBER plots of means and associations (r) of beliefs towards SARS‐CoV‐2 transmission with adoption of protective behaviours. Legend: In the right‐hand graphs, purple diamonds represent the score for current protective behaviour, and green diamonds represent the score of change between now and before outbreak. Figure 3c. CIBER plots of means and associations (r) of social dilemma variables with adoption of protective behaviours. Legend: In the right‐hand graphs, purple diamonds represent the score for current protective behaviour, and green diamonds represent the score of change between now and before outbreak. Figure 3d. CIBER plots of means and associations (r) of perceived external cues with adoption of protective behaviours. Legend: In the right‐hand graphs, purple diamonds represent the score for current protective behaviour, and green diamonds represent the score of change between now and before outbreak. Note: Abbreviations: PB = protective behaviours. C19 = COVID‐19. OE = outcome expectancy.
