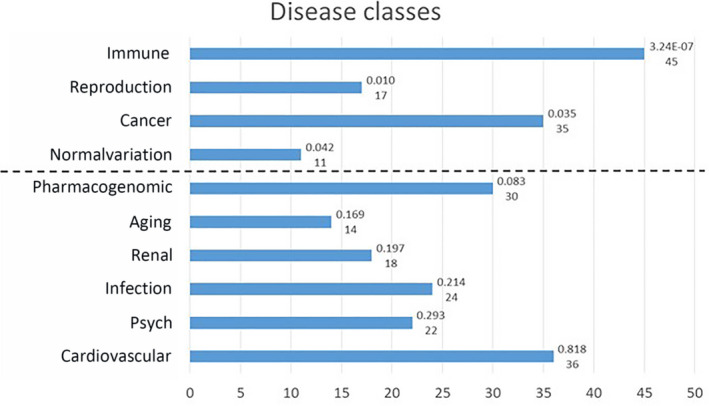
Fig. 1.

The GAD disease classes associated with the overall list of 105 genes. Numbers on the right indicate the P‐value (Bonferroni Šidák P‐value according to the DAVID manual) and the number of genes involved, according to DAVID analysis. The dash line separates classes with a significance below the threshold (P < 0.05: ‘Immune’, ‘Reproduction’, ‘Cancer’ and ‘Normalvariation’) from classes with a significance above the threshold. ‘Normalvariation’ is the name of one of the 18 sets of genes associated with diseases in genome‐wide association studies and other genetic association datasets from the GAD High Level Gene‐Disease Associations dataset. More details about diseases classes and genes included are available at the GAD link: https://maayanlab.cloud/Harmonizome/dataset/GAD+High+Level+Gene‐Disease+Associations.
