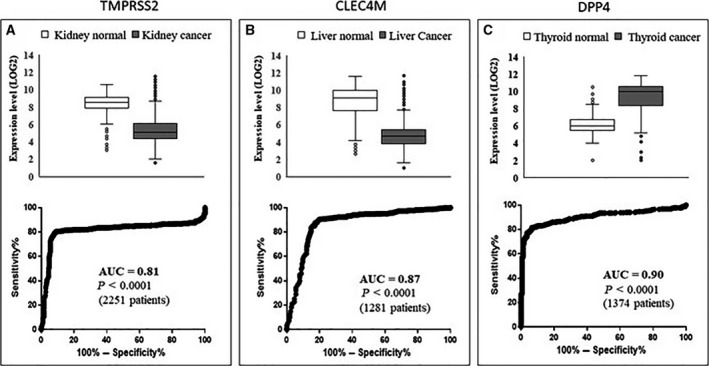
Fig. 2.

Differential expression in cancer versus normal tissues. Top: Differential RNA expression in cancer versus controls for TMPRSS2 (A), CLEC4M (B) and DPP4 (C) retrieved from the GENT2 database in kidney, liver and thyroid cancers, respectively. Bottom: ROC analysis carried out on data corresponding to the top panels. Boxes are obtained using excel and report the median value, quartiles and outliers.
