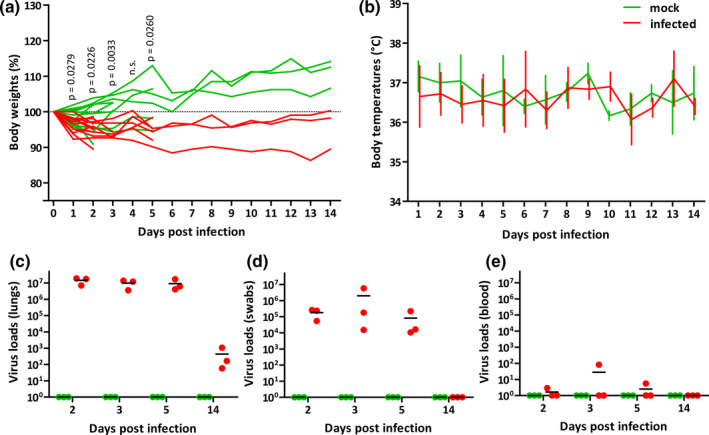
Figure 1.

Body weight changes, body temperatures and virus loads of mock‐infected and SARS‐CoV‐2‐infected Chinese hamsters. (a) Individual relative body weights of mock‐infected (green) and SARS‐CoV‐2‐infected (red) hamsters over the course of 14 days after infection. p‐values indicate significant differences (Mann–Whitney U test). (b) Temperature changes (as means with SD). Virus loads were determined from total RNA in (c) 2.5 mg homogenized right cranial lung lobes, in (d) bucco‐laryngeal swabs and (e) 2.5 µl of whole blood samples by RT‐qPCR [Colour figure can be viewed at wileyonlinelibrary.com]
