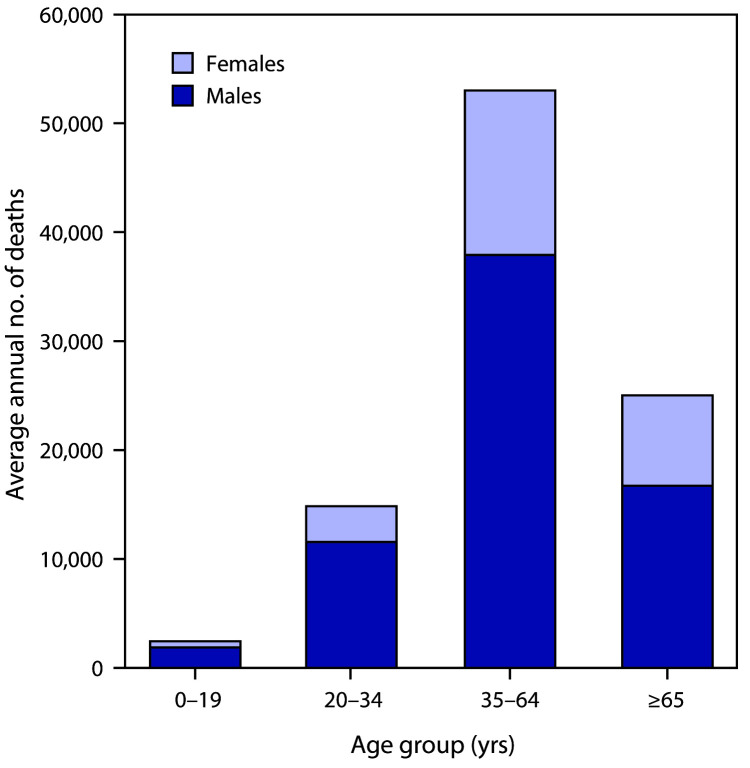
FIGURE.
Average annual number of deaths attributable to excessive alcohol use,* by sex and age group — United States, 2011–2015
* In the Alcohol-Related Disease Impact application (https://www.cdc.gov/ARDI), deaths attributable to excessive alcohol use include deaths from 1) conditions that are 100% alcohol-attributable, 2) deaths caused by acute conditions that involved binge drinking, and 3) deaths caused by chronic conditions that involved medium (>1 to ≤2 drinks of alcohol [women] or >2 to ≤4 drinks [men]) or high (>2 drinks of alcohol [women] or >4 drinks [men]) levels of average daily alcohol consumption.

