Fig. 2.
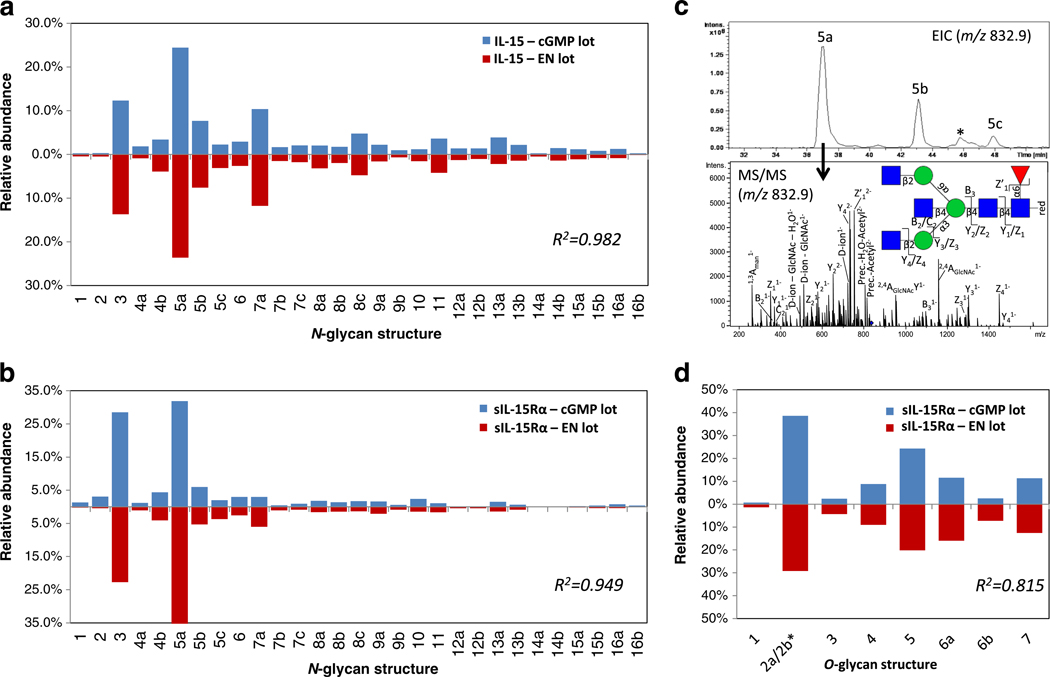
Glycome profiling demonstrates extensive and reproducible N-and O-glycosylation of IL-15 and sIL-15Rα in the large-scale preparations of hetIL-15 (cGMP and EN lots). N-glycans of IL-15 (a) and sIL-15Rα (b) were structurally characterized and quantitatively profiled using PGC-LC-ESI-negative ion-CID-MS/MS. c. Several isobaric N-glycan isomers were identified as exemplified by the extracted ion chromatogram (EIC) of the abundant Man3GlcNAc5Fuc1 composition (m/z 832.9 [M – 2 H]2−, upper panel) and the corresponding CID-MS/MS (bottom panel, see Fig. 3 for key to monosaccharide symbols) demonstrating three isobaric GlcNAc-terminating N-glycan isomers i.e. N-glycan structure 5a (shown), 5b and 5c (fragment spectra for the two latter N-glycans are presented in Supplementary Fig. S1). ‘*’ represents a non-glycan signal interference. d. The O-glycome profiling of sIL-15Rα showed less micro-heterogeneity. *Structure 2a/2b could not be consistently separated and were thus combined for quantitation purposes. No O-glycosylation was detected for IL-15 (data not shown). The N- and O-glycosylation profiles of IL-15 and sIL-15Rα of the EN (red bars) and cGMP (blue bars) lots of hetIL-15 were similar as evaluated by their high correlation coefficients (R2 = 0.815–0.982). The relative glycan quantities are averages of technical duplicates (see Supplementary Table S1 and S2 for exact values). The corresponding N- and O-glycan structures and their biosynthetic relationship are depicted in Fig. 3

