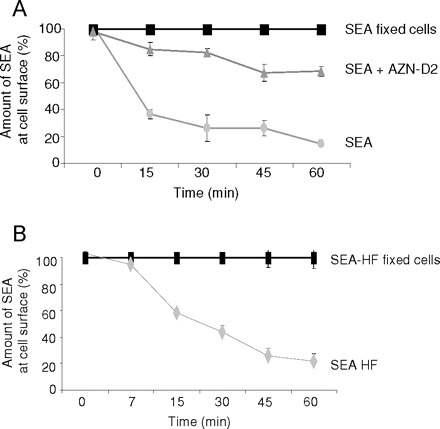
Fig. 2.

Internalization of SEA in L-SIGN-transfected cells. (A) Internalization of biotinylated SEA (grey circles) from the cell surface of K562 cells stably transfected with L-SIGN was analyzed after different time intervals of incubation at 37°C using flow cytometry. Fixed cells (black squares) were used to correct for the off-rate of SEA at 37°C. Internalization of biotinylated SEA in the presence of mAb AZN-D2 (grey triangles) is clearly reduced. Data represent mean values of duplicate determinations. The representative result of one out of three independent experiments is shown. (B) Internalization of defucosylated, biotinylated SEA (SEA-HF, grey diamonds) bound to the cell surface of L-SIGN transfected cells was analyzed at different time points of incubation at 37°C using flow cytometry. Fixed cells (black squares) were used to correct for the off-rate of biotinylated SEA-HF at 37°C. Values represent means of duplicates. A representative result out of two independent experiments is shown.
