Figure 3.

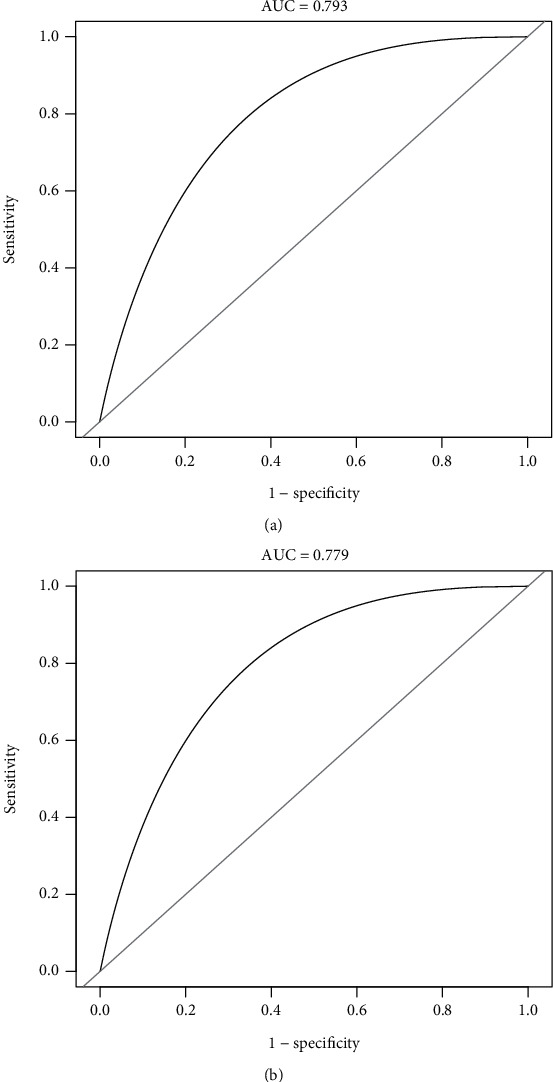
The ROC curves of the nomogram from the derivation cohort (a) and the validation cohort (b). ROC: receiver operating characteristics curves. ∗Using bootstrap resampling (times = 1000).

The ROC curves of the nomogram from the derivation cohort (a) and the validation cohort (b). ROC: receiver operating characteristics curves. ∗Using bootstrap resampling (times = 1000).