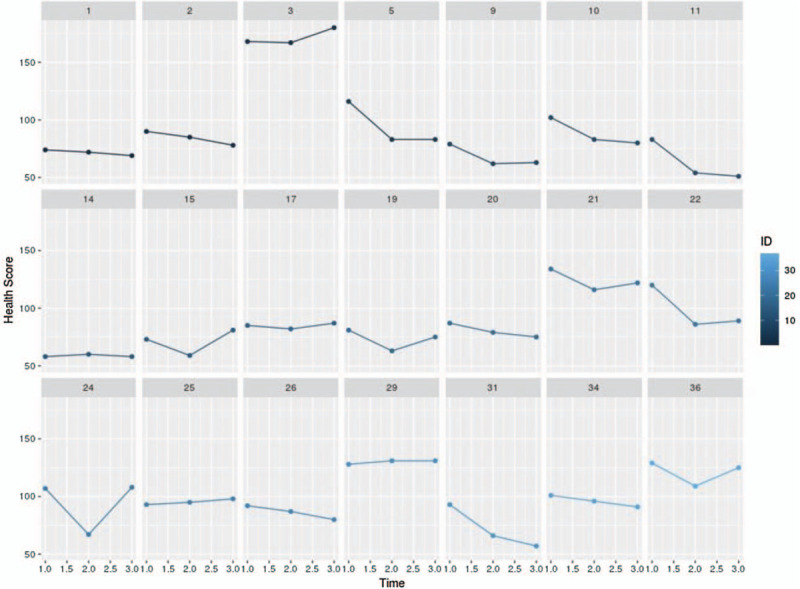
FIGURE 1.

Individual participant aggregated health condition scores over time (T1 to T3), where each plot represents a participant. Participant numbers are labeled above each plot.

Individual participant aggregated health condition scores over time (T1 to T3), where each plot represents a participant. Participant numbers are labeled above each plot.