
FIGURE 1.
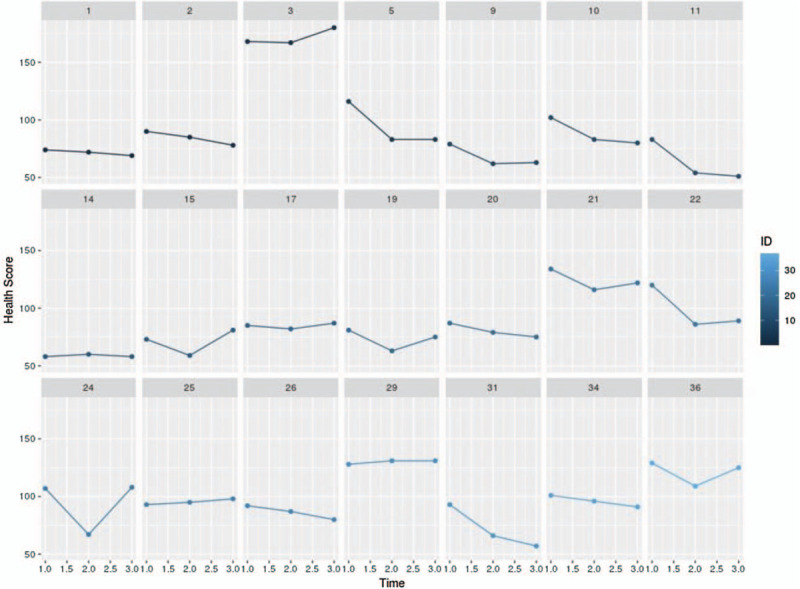
Individual participant aggregated health condition scores over time (T1 to T3), where each plot represents a participant. Participant numbers are labeled above each plot.
Official websites use .gov
A
.gov website belongs to an official
government organization in the United States.
Secure .gov websites use HTTPS
A lock (
) or https:// means you've safely
connected to the .gov website. Share sensitive
information only on official, secure websites.
Individual participant aggregated health condition scores over time (T1 to T3), where each plot represents a participant. Participant numbers are labeled above each plot.