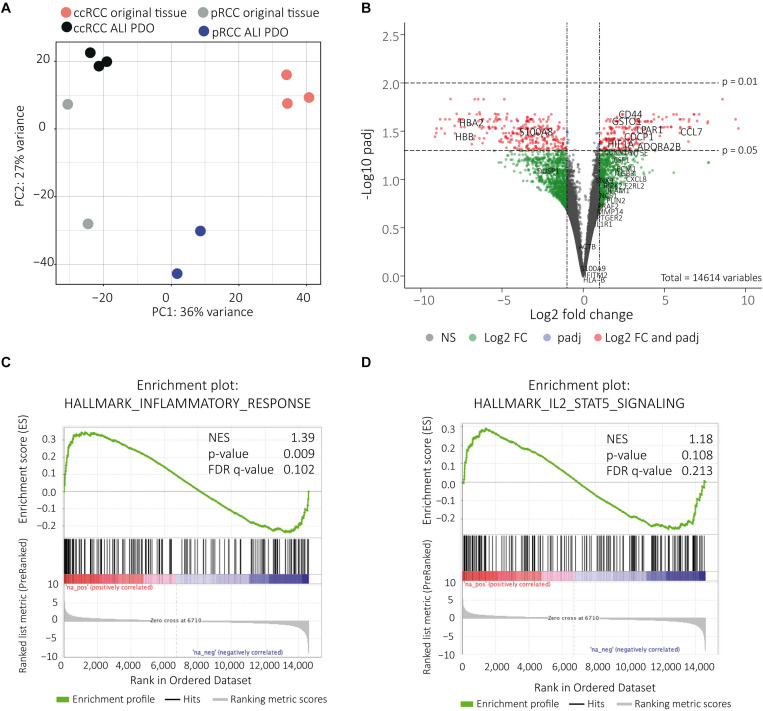
FIGURE 5.
RNA sequencing shows close molecular relationship. The close molecular relationship of the samples’ gene expression profiles was projected onto the first two principal components in a PCA plot (A). Volcano plot displaying the differentially expressed genes. Genes of interest, which are associated with inflammatory response and IL-2 STAT 5 signaling, are indicated in the up-regulated genes, genes expressed in blood are indicated in down regulated genes (B). Genes correlated with inflammatory response were up-regulated. NES = normalized enrichment score (C). Genes correlated with IL-2 STAT5 signaling were up-regulated. NES = normalized enrichment score (D).

