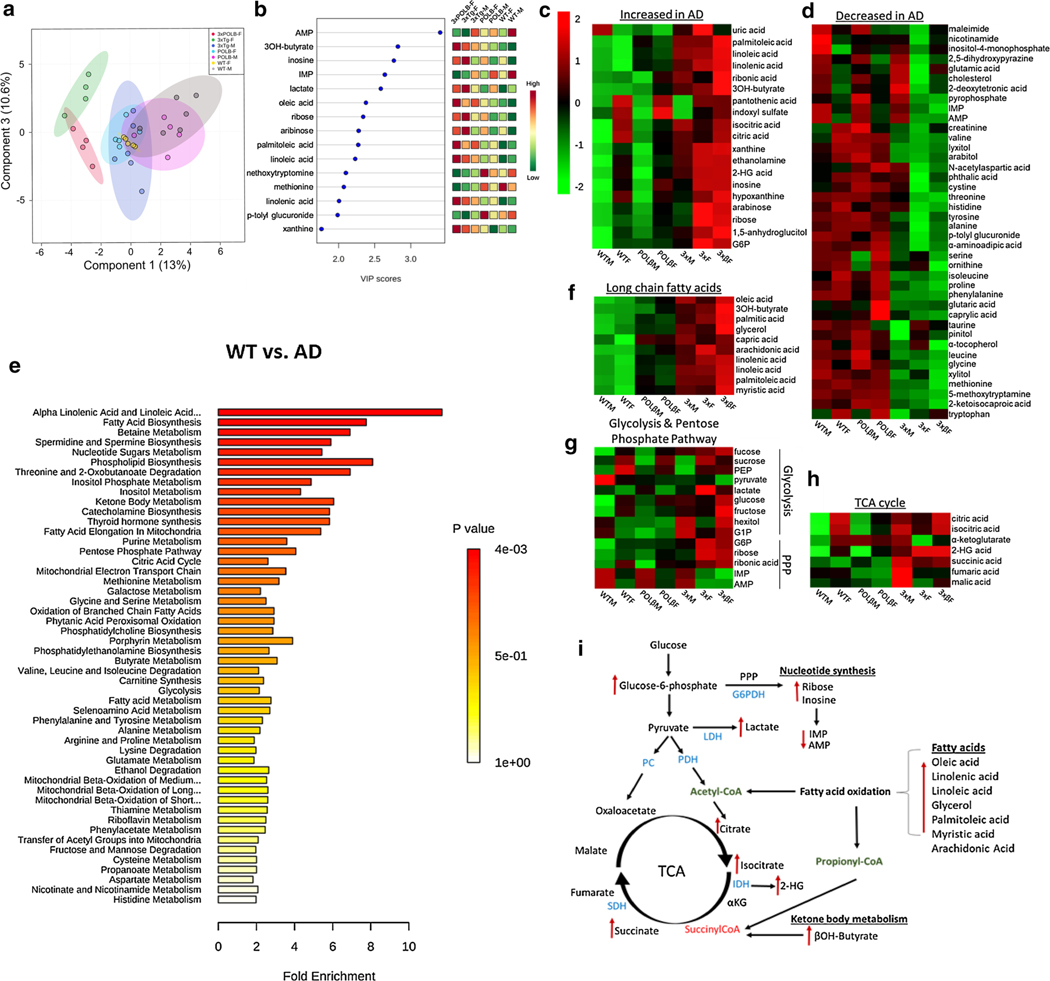
Fig. 3.
Systemic dysfunction of glycolysis, pentose phosphate, TCA cycle pathways and upregulation of fatty acid metabolism in plasma of AD mice. a Partial least squares discriminant analysis (PLS-DA) of plasma metabolic data and identified VIP metabolites (b). Heat map of upregulated (c) and downregulated (d) plasma metabolites in AD vs. WT mice. e Metabolite set enrichment (MEA) pathway analysis of WT vs. AD mice. f Upregulation of long-chain fatty acids (g) Glycolysis and Pentose phosphate pathway alterations, h TCA cycle metabolites and i summary of significant metabolite changes in metabolic pathways indicated by red arrows (right). Data analyzed with Metaboanalyst v4.0 [87] following log transformation to fit a gaussian distribution and analyzed using One-way ANOVA with Tukey HSD post hoc test with 0.05 FDR for multiple comparisons, n = 4–6 mice/group

