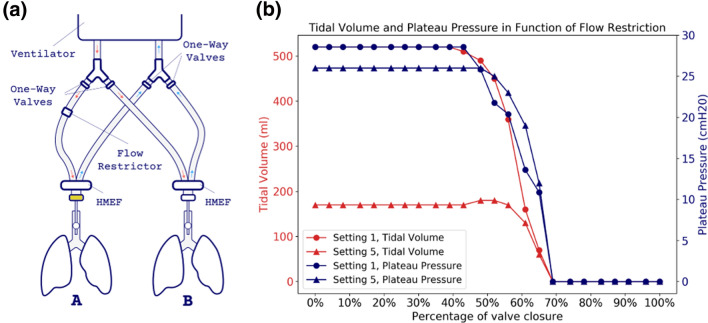
Fig. 2.
Measurement of the Volumes and Plateau Pressures as a function of the flow restrictor. a Set-up used for this experiment with the flow restrictor on the inspiratory limb of circuit A. b Tidal Volume in red and Plateau Pressure in blue as function of the valve closure for setting 1 (circles) and setting 5 (triangles)

