
Fig. 5. Tracing 46 regions along Chromosome X.
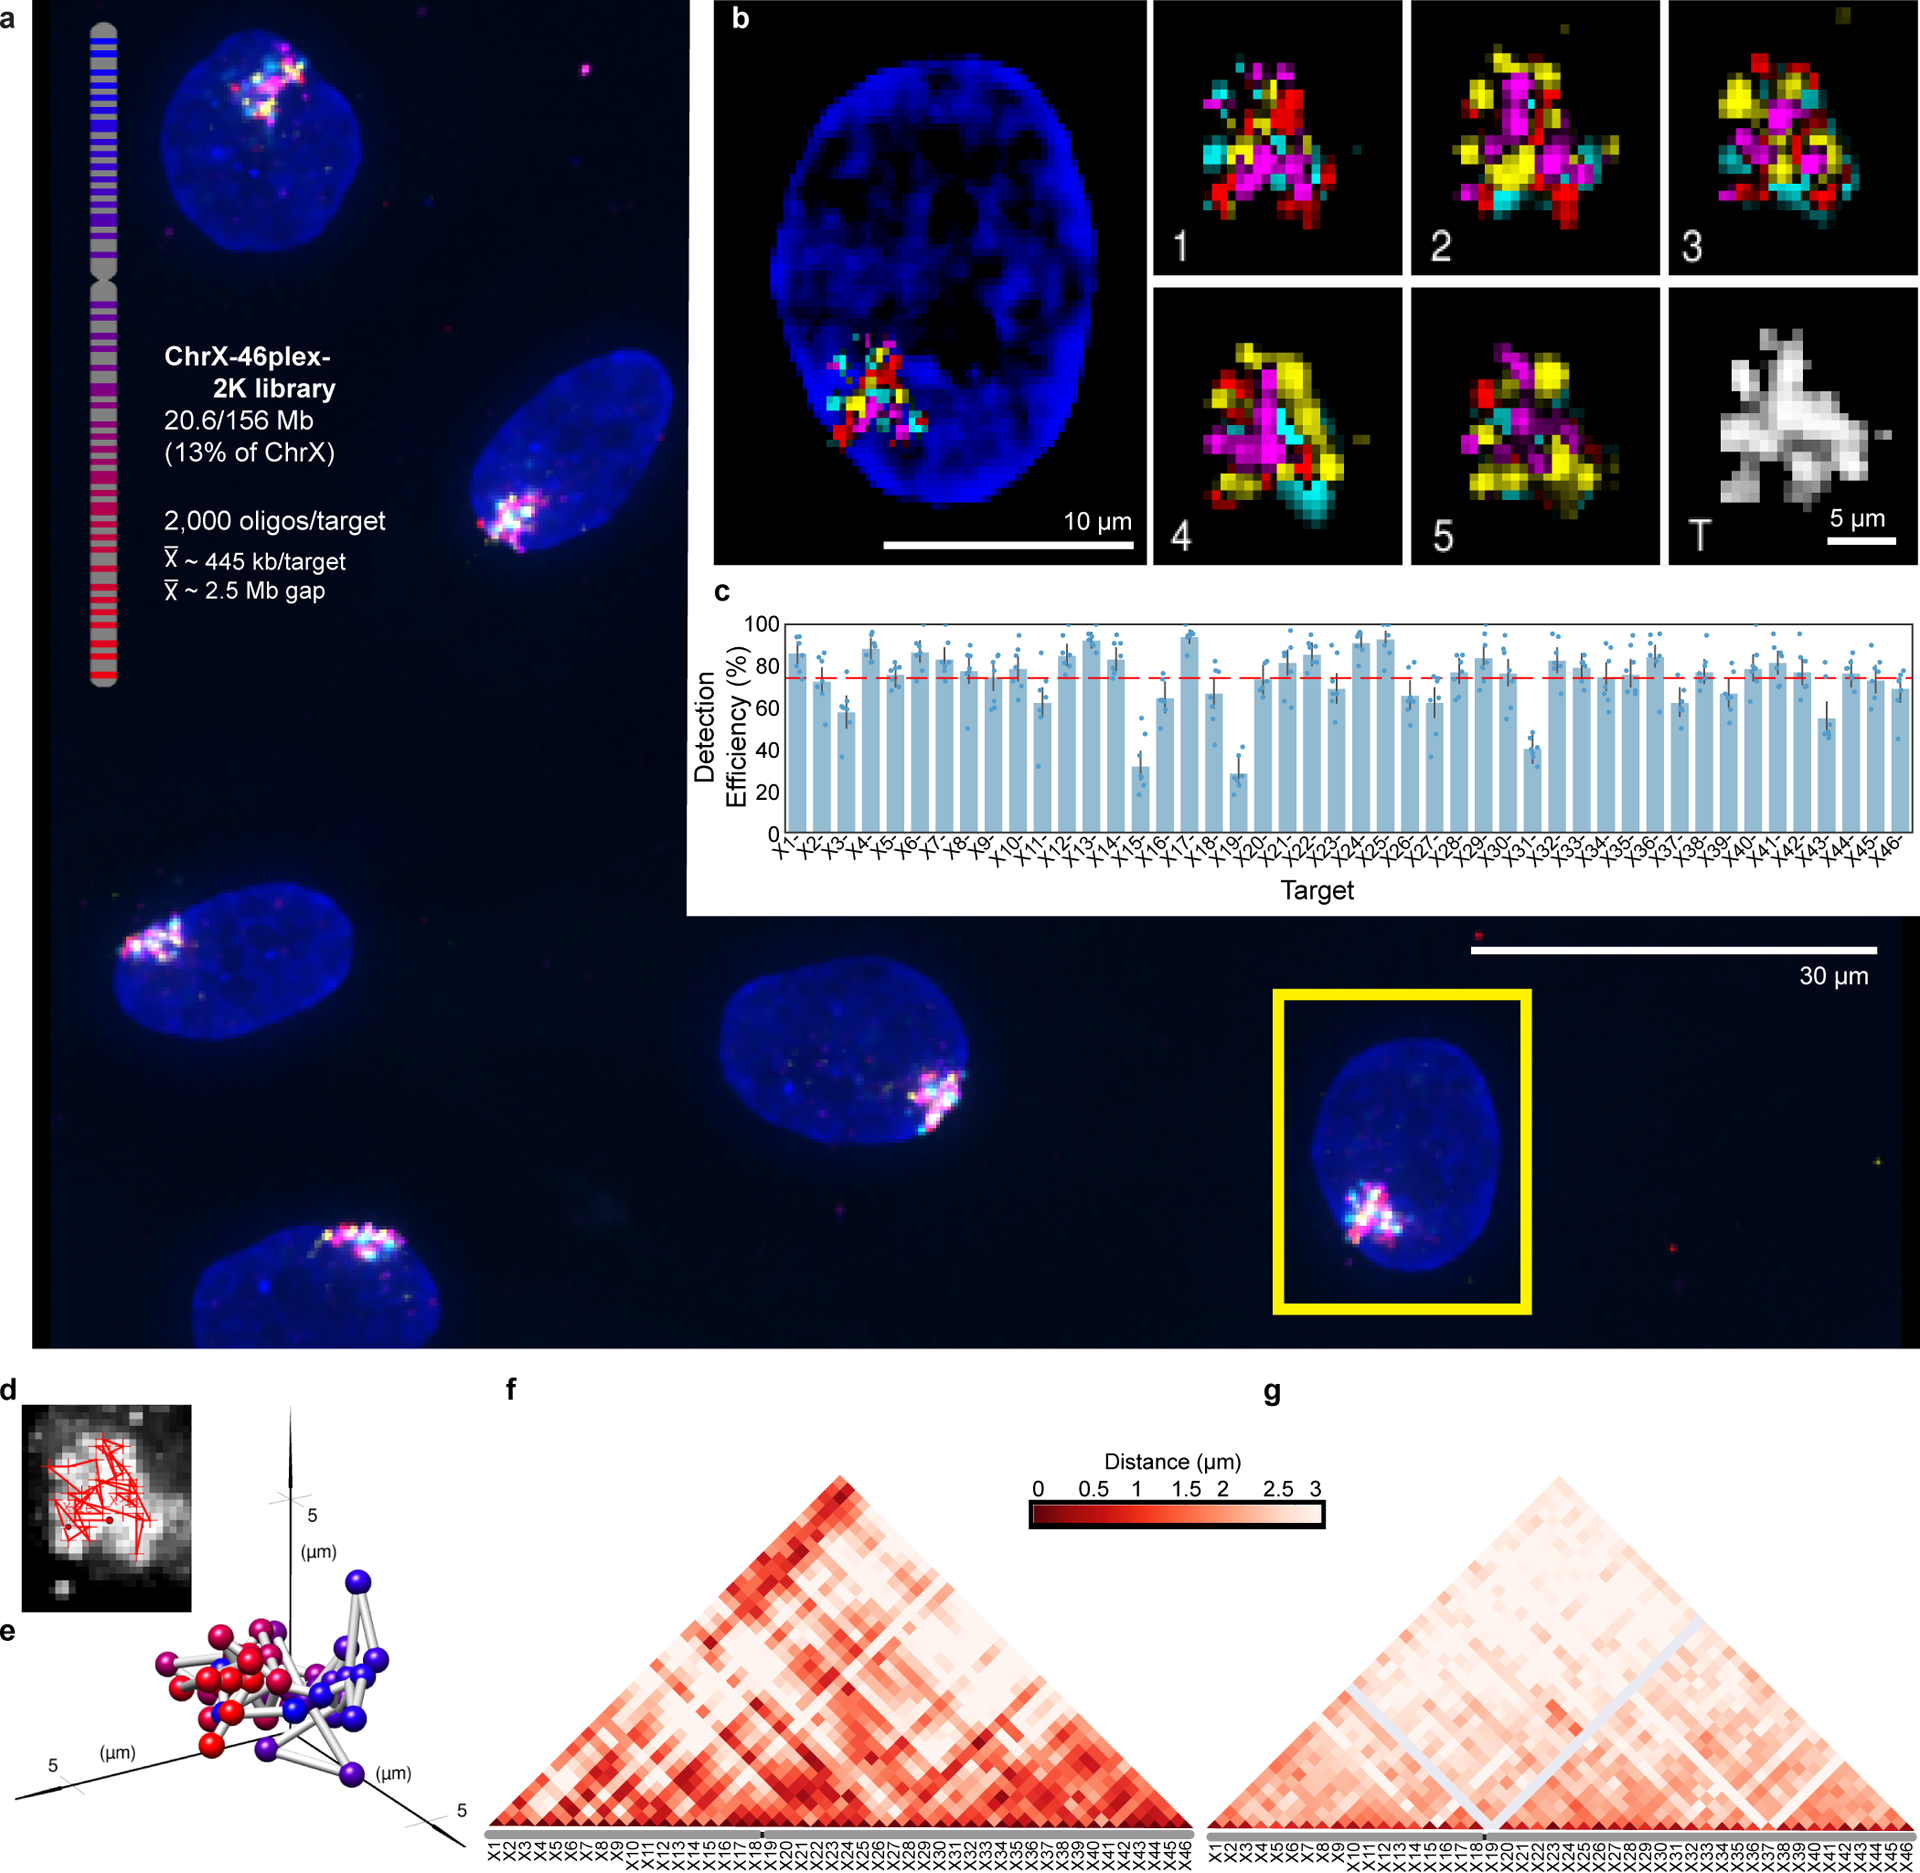
a) Targets of ChrX-46plex-2K and nuclei after a first round of O-eLIT sequencing off of both streets in PGP1f. Images are from deconvolved maximum intensity z-projection. n = 1.
b) Five rounds of sequencing with O-eLIT off of both streets. Nucleus from panel a (yellow square). Left, view of DAPI stained nucleus after first round of sequencing. White numbers, round of sequencing. T, totality of targets labeled simultaneously with a secondary oligo complementary to a barcode present on all oligos. Images are from deconvolved maximum z-projection. n = 1.
c) Tier 2 target detection efficiency after five rounds of O-eLIT off of both streets in PGP1f cells. The mean detection efficiency marked by the red dashed line was 74.29 ± 2.5% (n = 177 from 7 replicates), averaging detection efficiencies off of one street (73.7 ± 2.97%, n = 122 from 5 replicates) and off of both streets (75.3 ± 1.97%, n = 55 from 2 replicates). Particularly difficult was X19, being detectable only 0% and 28% of the time after Tier 1 (Extended Data Fig. 6a) and Tier 2, respectively Detection efficiency from individual replicates are plotted. Error bars represent 95% bootstrap confidence interval of the mean.
d-e) Chromosome traces (d) and 3D visualization (e) of the nucleus in Figure 5b after Tier 2 analysis and interpolation of missing targets. Sphere color corresponds to chromosome cartoon in panel a. n = 1.
f) Single-cell pairwise spatial distances after interpolation of missing targets of nucleus in panel b.
g) Population pairwise spatial distances (n = 177 from 7 replicates) after Tier 1 detection (combining reads off of Mainstreet with reads off of both streets).