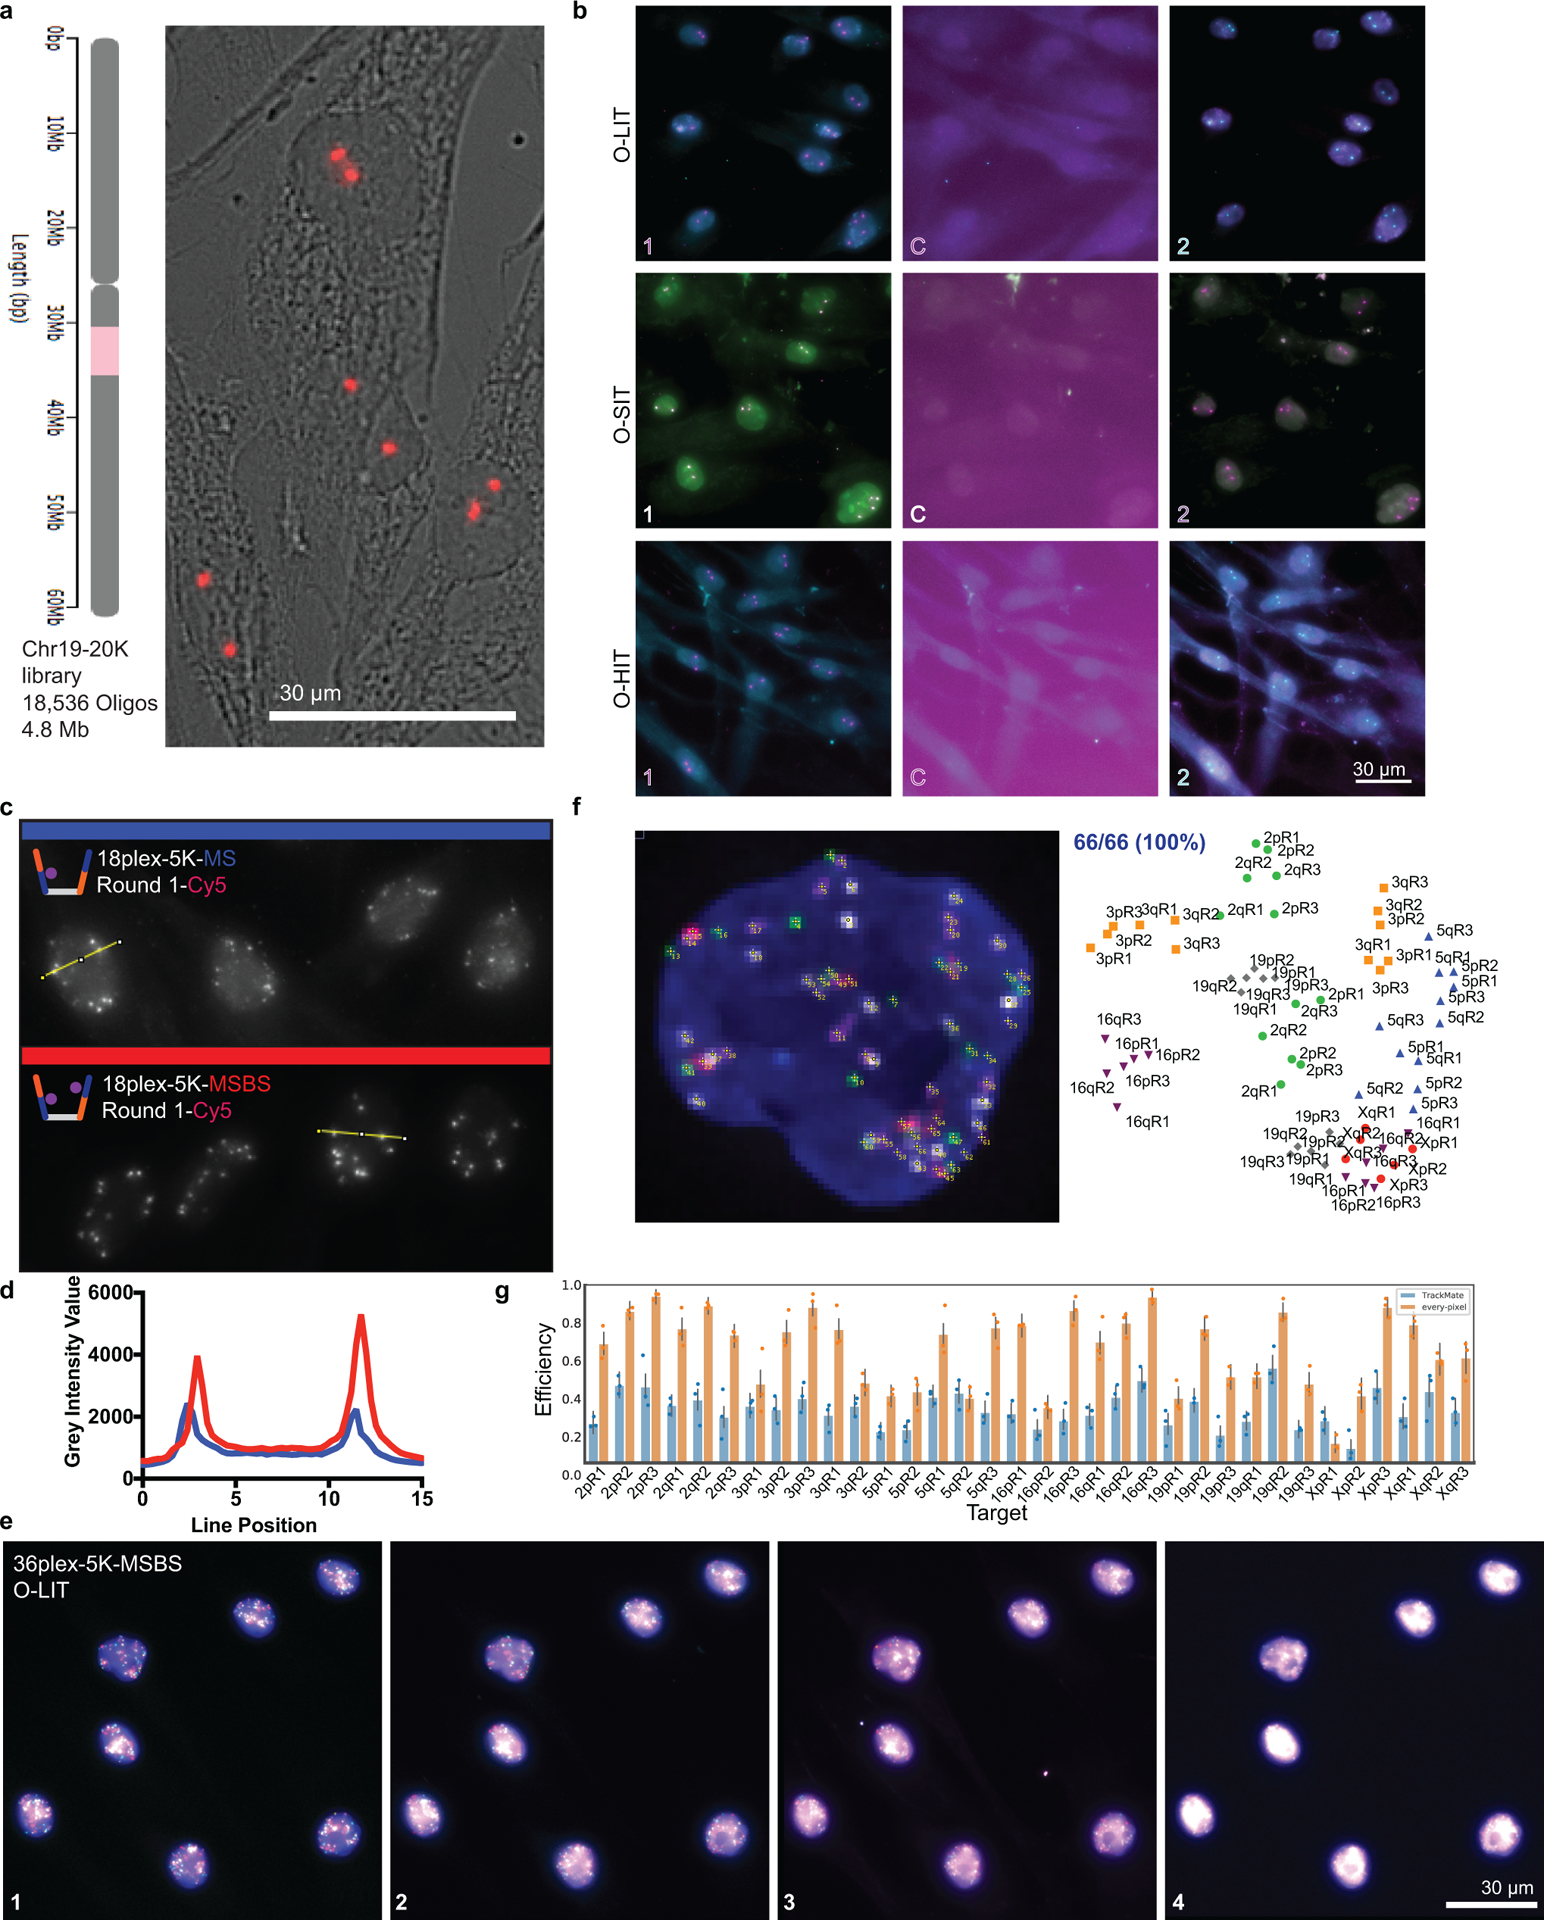
Extended Data Fig. 1. Chr19–20K and 36plex-5K-O-LIT optimization.

a) Chr19–20K targets 18,536 Oligopaint oligos to human chromosome 19. Right, Chr19–20K detection with secondary oligo (red) in PGP1f cells representative of 5 replicates.
b) Signal is completely removed in each OligoFISSEQ method after cleavage. Images showing two rounds of sequencing with a cleavage step (C) and representative of 4 replicates.
c) 36plex-5K O-LIT off of both Mainstreet and Backstreet (MSBS; bottom, red) produces stronger signal than off of Mainstreet (MS; top, blue). Cy5 channel from first round of O-LIT. n = 1.
d) O-LIT off of both streets produces stronger signal than off of MS. Grey intensity value measurements from yellow lines in panel c. n = 1.
e) Raw, non-deconvolved field of view of cell from Figures 2c–d and 3a–c. Maximum z-projection. n = 1.
f) Manual decoding of cell from panel c and Figures 2c–d and 3a–c yields 100% target recovery. n = 1.
g) Tier 1 detection efficiency after 36plex-5K O-LIT off of both streets and detected with TrackMate (blue, 29.93 ± 4.9%) or Every-pixel (orange, 62.8% ± 4.8%). n = 111 cells from 3 replicates. Detection efficiency from individual replicates are plotted. Error bars represent 95% bootstrap confidence interval of the mean.
