FIGURE 3.
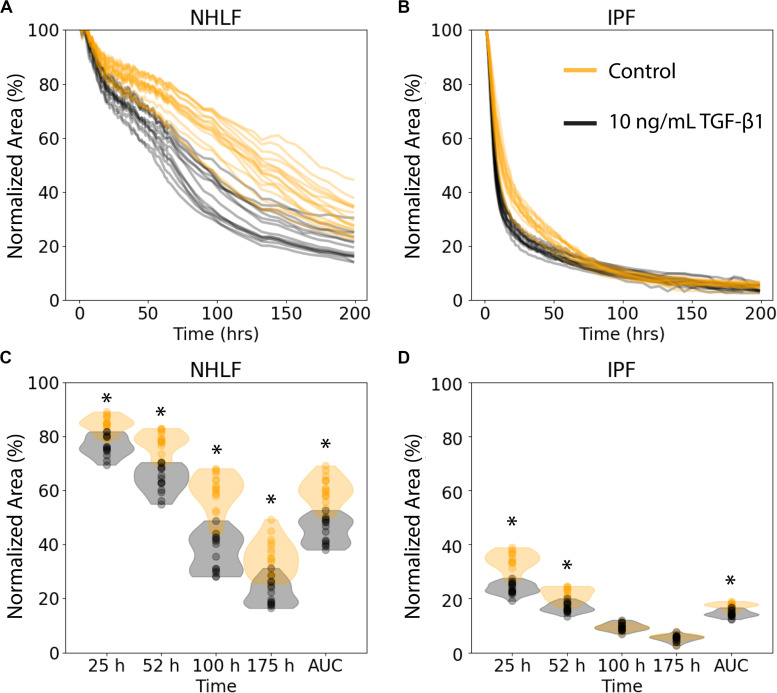
Collagen microgel contraction kinetics and use of an aggregate statistic to distinguish contraction behavior depending on imaging timepoint. (A) Normalized area of collagen gels over time for NHLF and (B) IPF cells. Each line represents an individual gel. Orange curves are for control samples, and black curves are for cells stimulated with 10 ng/ml TFG-β1. (C) Contraction of NHLF and (D) IPF cells in response to stimulation with 10 ng/mL TGF-β1. The ability to discern a difference in response depends on the timepoint at which measurements are made. However, the area under the curve more readily and consistently reflects these differences. n = 15 per condition. *p < 0.05 between the +/− TGF-β1 conditions on multiple t-tests with a Bonferroni correction.

