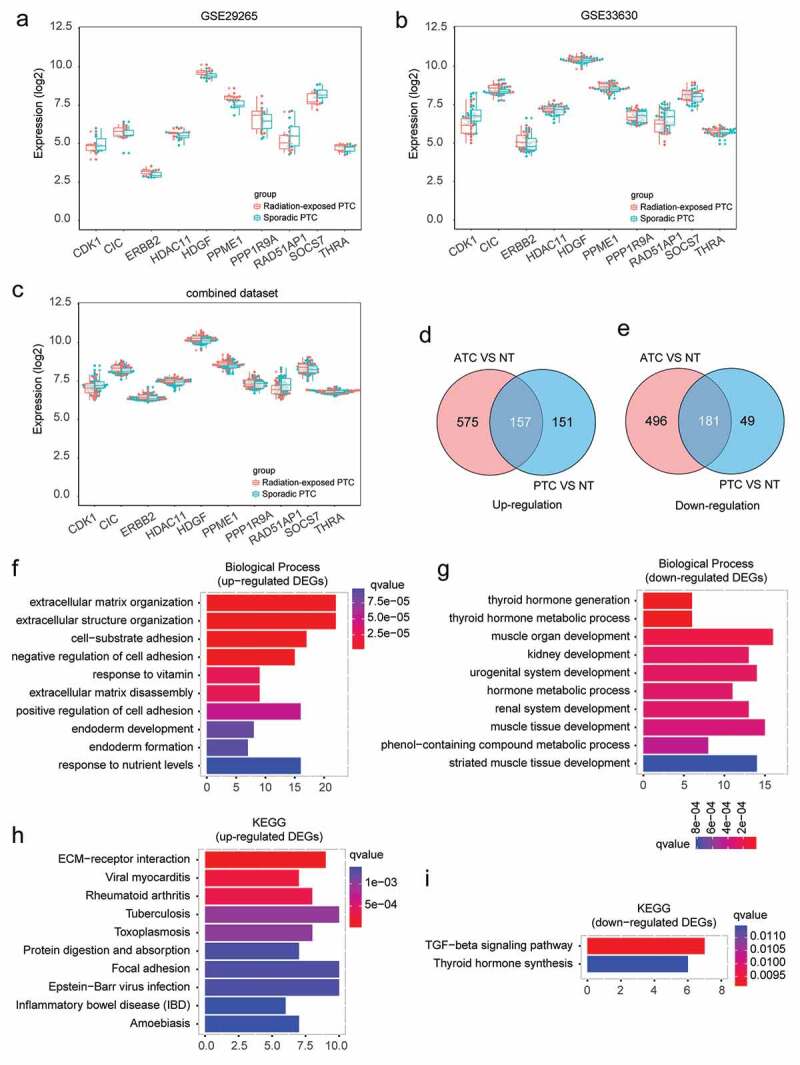
Figure 1.

Identification and biological function annotation of thyroid cancer associated DEGs. (a-c) Expression of radiation signature in sporadic and radiation-exposed PTC from GSE29265, GSE33630, and combined dataset. (d-e) Consistently up- and down-regulated DEGs in ATC and PTC by comparing to normal thyroid tissues. (f-g) GO Biological Process annotation of up- and down-regulated DEGs, respectively. Top ten significantly enriched GO terms with lowest q value were plotted. (h-i) Pathway enrichment of up- and down-regulated DEGs by Kyoto Encyclopedia of Genes and Genomes (KEGG), respectively. Top ten significantly enriched pathways with lowest q value were plotted.
