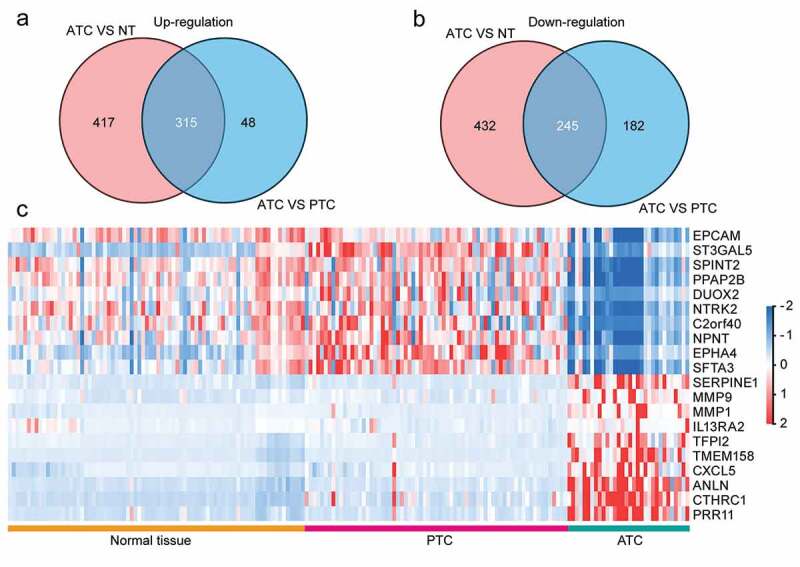
Figure 2.

Identification of ATC-specific malignant signatures. (a) Intersection of consistently up-regulated DEGs in ATC as compared with normal thyroid tissues or PTC. (b) Intersection of consistently down-regulated DEGs in ATC as compared with normal thyroid tissues or PTC. (c) Heatmap of top 10 up and down-regulated DEGs in ATC.
