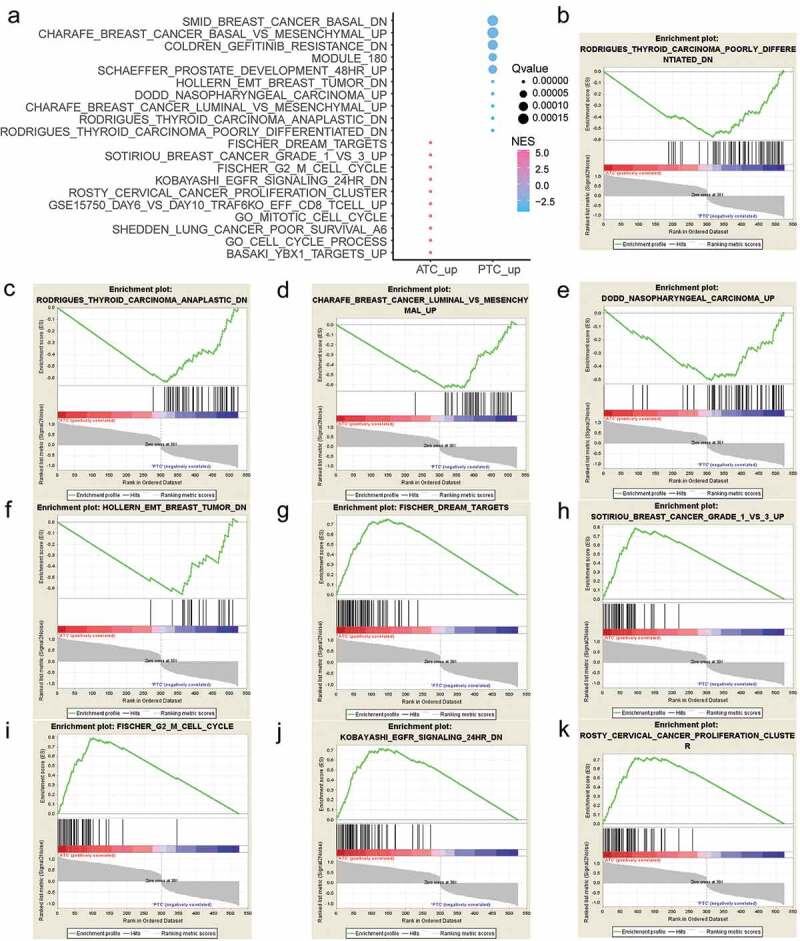
Figure 3.

Gene Set Enrichment Analysis (GSEA) of ATC-specific DEGs. (a) The top 20 gene sets that positively or negatively correlated with ATC. (b-f) Enrichment plot of top 5 enriched gene sets that up-regulated in PTC. (g-k) Enrichment plot of top 5 enriched gene sets that up-regulated in ATC. NES, normalized enrichment score.
