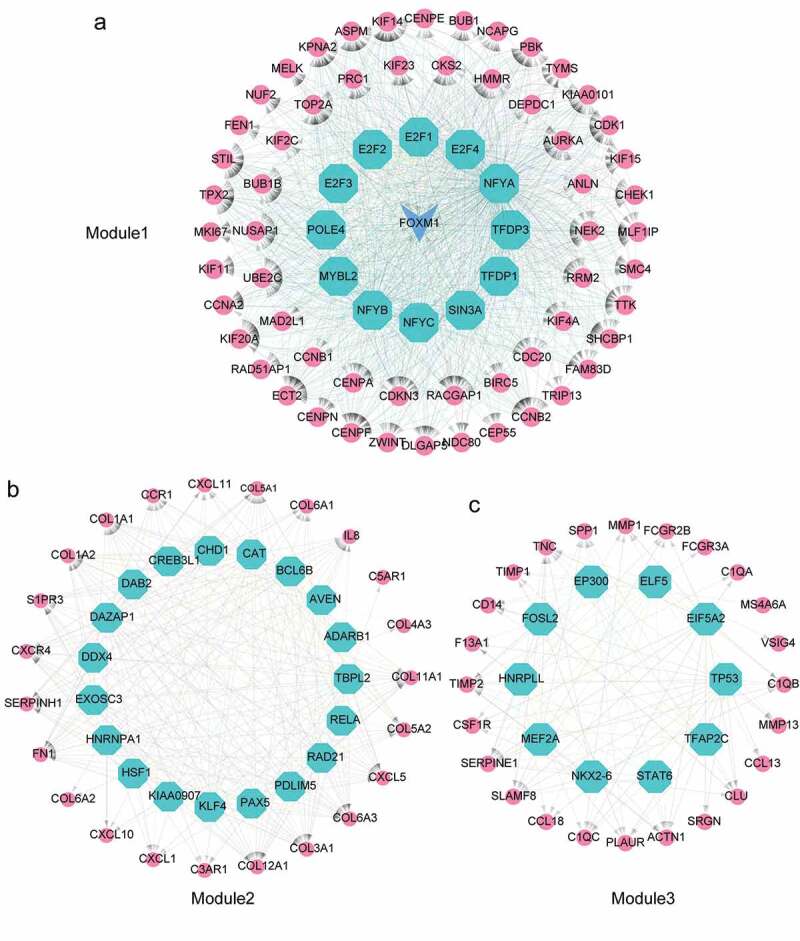
Figure 6.

Identification of master regulators in regulatory network of ATC-specific modules. (a-c) Results of the regulatory analysis with iRegulon on three most scored modules. The red nodes represented regulated targets. The blue node was regulator and/or regulated target. The light cyan nodes indicated transcription factors.
