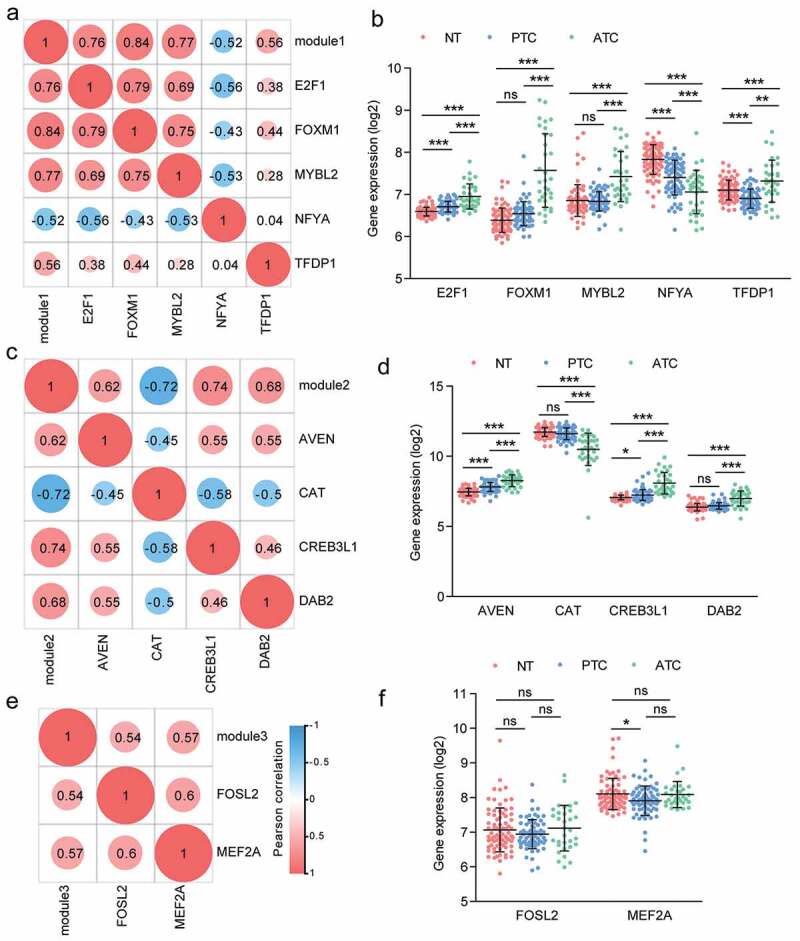
Figure 7.

Correlation analysis of master regulators and three modules. (a, c, e) Pearson correlation analysis of TFs and modules. (b, d, f) The expression profile of TFs with Pearson r > 0.5 or < −0.5 were queried from microarray dataset. Results were showed as means ± SD in each group. * P < .05, ** P < .01, *** P < .001.
