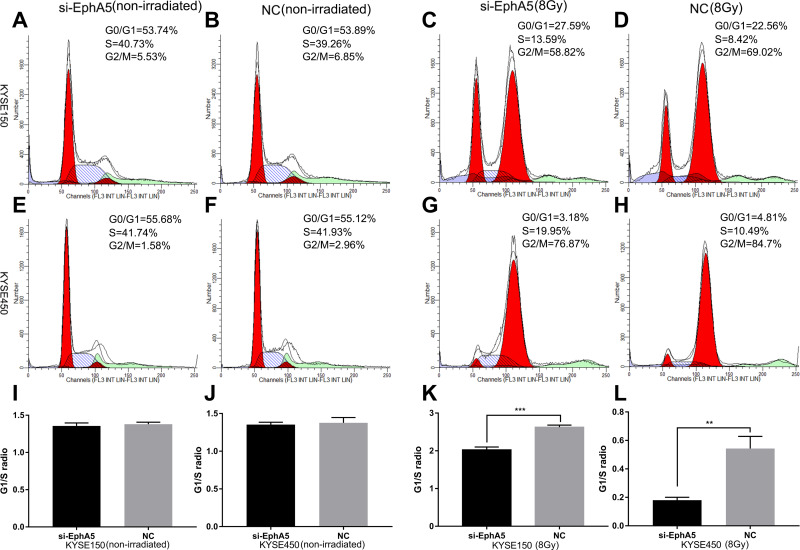
Figure 3.
Cycle changes of esophageal squamous cells after EphA5 downregulation. KYSE150-siEphA5 (A), KYSE150-NC (B), KYSE450-siEphA5 (C), KYSE450-NC (D), without IR; KYSE150-siEphA5 (E), KYSE150-NC (F), KYSE450-siEphA5 (G), KYSE450-NC (H), after IR; Comparison of G1/S ratio between si-EphA5 and NC cells without IR (I and J); Comparison of G1/S ratio between si-EphA5 and NC cells receiving 8Gy irradiation (K and L). **P<0.01,***P<0.001.

