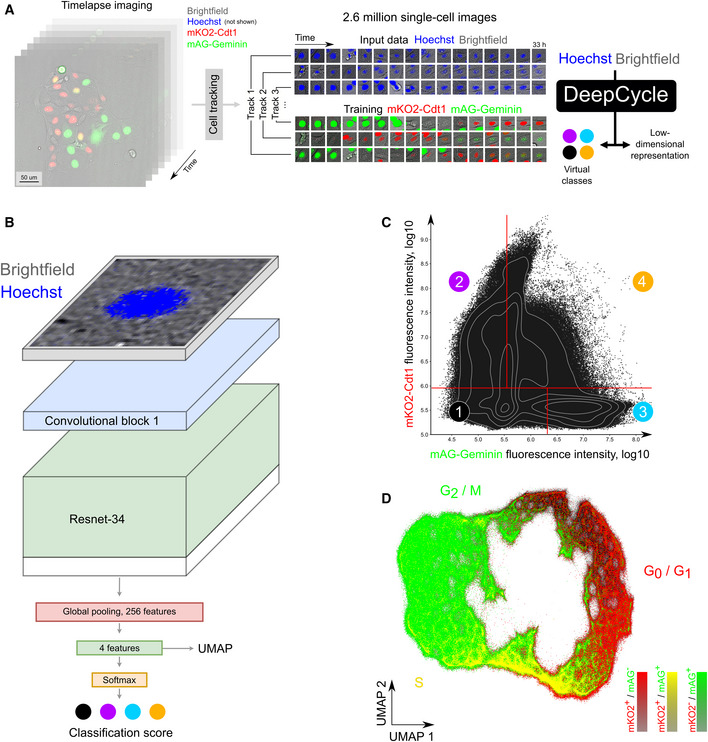
Figure 1. DeepCycle reconstructs a cell cycle closed trajectory from single‐cell microscopy images.

- A tiled time‐lapse microscopy imaging of MDCKII cells with the FUCCI2 system was performed over the area of approximately 5 × 5 mm for 33 h followed by automated cell tracking, generating 2.6 million individual cell images. For each track, the brightfield and Hoechst channels of unsegmented cell images centered at the nucleus were used as input for the DeepCycle deep learning network. Four virtual classes were defined by relative intensities of the FUCCI2 channels (mKO2‐Cdt1 and mAG‐Geminin) and used as ground truth for training the DeepCycle network. For contrast enhancement in this figure, the fluorescent intensities of each miniature single‐cell image were clipped at their 70 percentile.
- The architecture of the DeepCycle convolutional neural network. A 2‐channel cell image is transformed into 3‐channel and fed into ResNet‐34 pre‐trained on ImageNet. Then, a 256 feature map is generated by a conv4 block global average pooling followed by a fully connected layer and a softmax layer generating the probabilities of a cell to belong to each of the four virtual classes illustrated in (C). The values obtained before the softmax layer are used as features for a low‐dimensional representation of the cells as visualized in (D).
- Virtual classes of cells derived from the FUCCI2 intensities (mKO2 and mAG) which serve as ground truth for training the neural network (classification accuracies are reported in Appendix Fig S2). The virtual classes were designed to have similar numbers of cells and represent cells with different combinations of mAG and mKO2 intensities.
- The DeepCycle low‐dimensional representation of the cells. Coloring cells by their corresponding FUCCI2 expression profile (green: mAG+/mKO2−; red: mAG−/mKO2+; yellow: mAG+/mKO2+) reveals a continuous and cyclic progression through the cell cycle.
