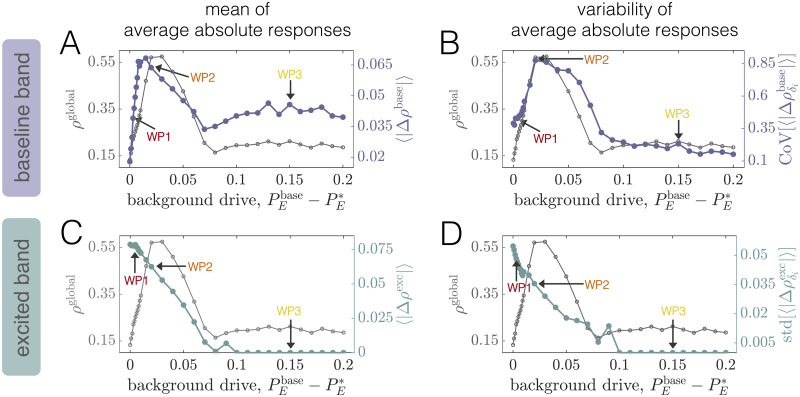
Fig 8. Dependence of global phase-locking changes on the baseline state of the brain network model.
(A) The left axis (gray) shows the network-averaged baseline PLV ρglobal as a function of background drive for a coupling C = 2.5. The right axis (purple) shows the grand average 〈|Δρbase|〉 of the perturbation-induced absolute changes in baseline band PLVs as a function of . (B) The left axis (gray) shows the network-averaged baseline PLV ρglobal as a function of background drive for a coupling C = 2.5. The right axis (purple) shows the coefficient of variation of the perturbation-induced average absolute changes in baseline band PLVs, , as a function of . (C) The left axis (gray) shows the network-averaged baseline PLV ρglobal as a function of background drive for a coupling C = 2.5. The right axis (green) shows the grand average 〈|Δρexc|〉 of the perturbation-induced absolute changes in excited band PLVs as a function of . (D) The left axis (gray) shows the network-averaged baseline PLV ρglobal as a function of background drive for a coupling C = 2.5. The right axis (green) shows the standard deviation of the perturbation-induced average absolute changes in excited band PLVs, , as a function of . (Note that here we consider the standard deviation rather than the coefficient of variation since the mean response in the excited band eventually drops to zero.).

