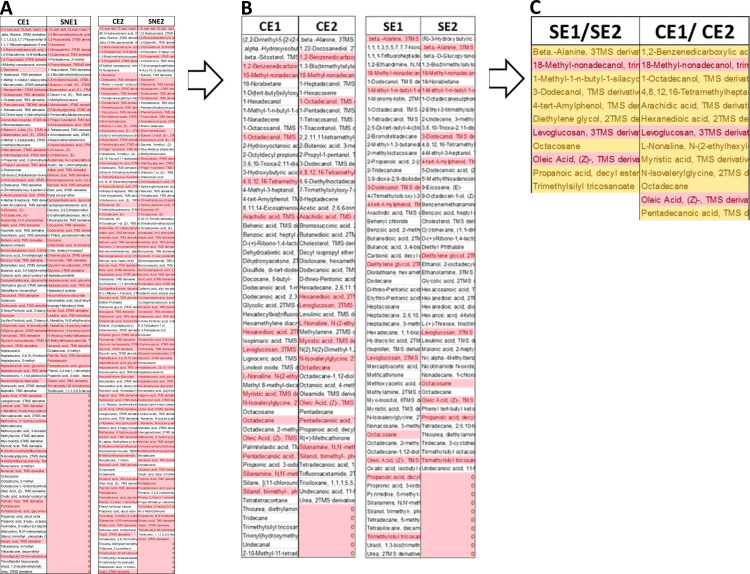
Fig 6. Identification of metabolites involved in biogenesis of AuNPs using GC-MS analysis.
Metabolites (SNE1 and SNE2) extracted from the solution obtained after the generation of AuNPs were compared to the parent metabolites extracts (CE1 and CE2) used for their generation. The metabolite difference in the parent metabolites were selected and re-compared to metabolites extracted from cell-free supernatants (ES1 and ES3). Gold chloride was incubated with metabolites extracts dissolved in PBS for 4–6 days until the color changes. The cultures were spin down and the supernatant was collected. The supernatant was re-extracted with ethyl acetate prior to GC-MS analysis. The results obtained were compared with control extracts treated similarly but without gold chloride. (A) Metabolites comparison between gold chloride-treated versus non-treated samples. Light red-colored metabolites are shared metabolites between samples, while the uncolored metabolites are different. (B) Only metabolites identified from control samples (CE1 and CE2) but not the treated ones were compared to metabolites extracted from supernatants (SE1 and SE2). Light red-colored metabolites are shared metabolites between samples, while the uncolored metabolites are different. (C) Only shared metabolites were combined from supernatants versus cells. Light red-colored metabolites are shared metabolites between samples, while the orange metabolites are different.

