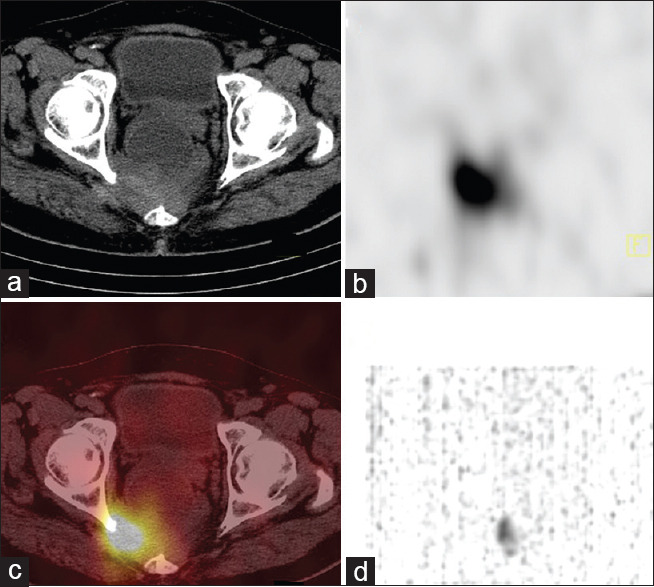
Figure 3.

Actinium225 tetraazacyclododecanetetraacetic acid–octreotide singlephoton emission computed tomography/computed tomography (axial computed tomography (a), singlephoton emission computed tomography (b), fused singlephoton emission computed tomography/computed tomography (c) and Maximum intensity projection(MIP) image(d) showing intense uptake in the right pararectal lesion
