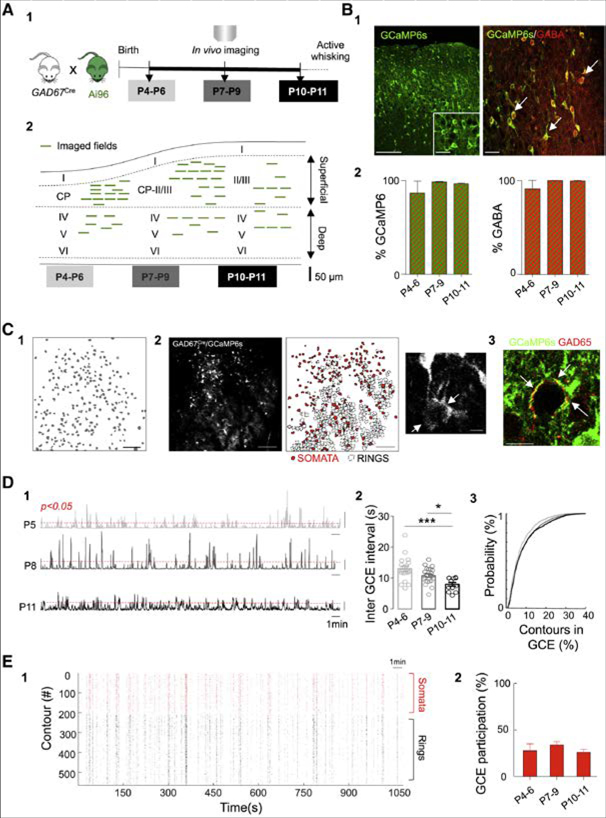
Figure 1. GABAergic Calcium Events (GCE) Recurring during Postnatal Development.
(A) Schematic representation of the experimental timeline (A1). Experiments were performed in non-anesthetized GAD67-GCaMP6s pups between postnatal days 4 (P4) and 11 (P11). Location of the fields of view (FOV, green lines) at P4-P6 (superficial layers = 13, and deep = 6), P7-P9 (superficial = 17, deep = 7) and P10-P11 (superficial = 7, deep = 5) (A2). Each line represents one imaged field of view.
(B) Immunohistochemistry and quantification of GCaMP6s expression and GABA co-labeling to test the GABAergic identity of imaged cells (B1 and B2). White arrows indicate co-expression of GCaMP6s (green) and GABA (red). Scale bars, 100 μm and 20 μm, respectively. Bar plots (B2) indicate the fraction of GCaMP6s positive contours expressing GABA (left) as a function of developmental time (P4-P6: 87% ± 12%; P7-P9: 99% ± 0.5%; P10-P11: 97% ± 0.8%, n = 2, 3, 2 FOV for each age, 2 animals per age) as well as the fraction of GABA contours expressing GcaMP6s (right) (P4-P6: 90% ± 9%; P7-P9: 99% ± 0.1%; P10-P11: 99% ± 0.5%, n = 2, 3, 2 FOV for each age, 2 animals per age).
(C) Representative contour plot of the active SOMATA detected in a FOV (scale bar 100 μm) (C1). Maximum intensity projection of a representative field of view (600 × 600 μm; scale bar, 100 μm) and detection of GABAergic SOMATA (red filled) and RINGS (black contours) (C2). Magnification of a Ring detail (scale bar 10 μm). Immunohistochemical analysis of GCaMP6s (green) expression and GAD65 (red) shows that RINGS are often co-labeled with GAD65 (red) (see arrows, scale bar 20 μm) (C3).
(D) Representative histograms showing the number of active contours as a function of time within imaging sessions at P5 (top), P8 (middle), and P11 (bottom) (D1). Scale bar, 50 contours. Red dotted line indicates statistical threshold above which the number of co-active contours exceeds chance levels (p < 0.05). Bar plots of the average time interval between GCEs as a function of age (open circles indicate one FOV) (D2). Two-way ANOVA shows no interaction (F(2,49) = 2.23, p = 0.11) or depth effect (F(1,49) = 0.65, p = 0.42) but an age main effect (2, F(2,49) = 13.69, p < 0.0001). Post hoc test (Tukey) indicates a decrease in the inter-GCE interval overtime: P10-P11 versus P4-P6 (p < 0.001) and P10-P11 versus P7-P9 (p < 0.05). Cumulative probability distribution of contours recruitment into GCEs at P4-P6, P7-P9 and P10-P11. Kolgomorov-Smirnov test, adjusted α = 0.05/3. P4-P6 versus P7-P9 and P10-P11, p < 0.01 (D3).
(E) Representative rasterplot indicating calcium events onsets detected in SOMATA (red) and RINGS (black) in a given imaging session as a function of time (E1). Fraction of SOMATA recruited in GCEs at different developmental stages (E2). One-way ANOVA indicates no differences between the fraction of SOMATA recruited within GCEs over time; F(2,53) = 0.66; p = 0.51. Data in the plot are represented by mean ± SEM.

