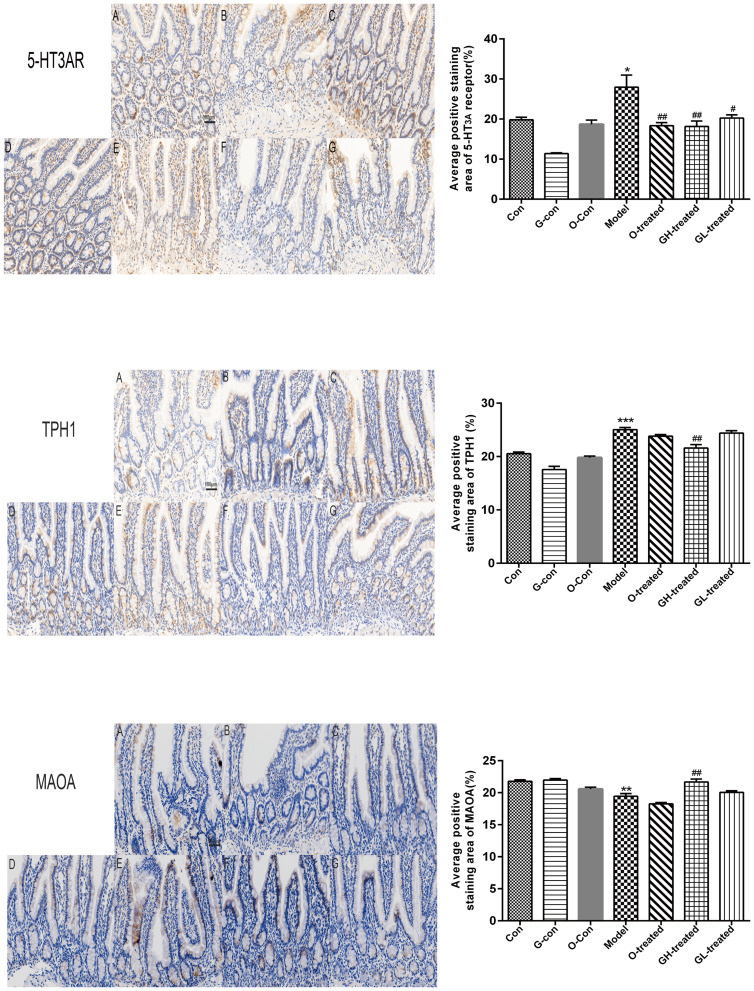
Figure 10.
TPH-1, MAO-A, and 5-HT3 receptor immunostaining in ileum.
Notes: Values were expressed as mean ± SEM (n = 6). *P < 0.05, **P < 0.01, ***P < 0.01, compared to the control group; #P < 0.05, ##P < 0.01, compared to the cisplatin model group. (magnification × 200, scale bars = 100 μm).
Abbreviations: Con, normal control group; G-con, the [6]-gingerol control group; O-con, the ondansetron control group; Model, the cisplatin model group; O-treated, the ondansetron-treated model group; GH-treated, the high dosage of [6]-gingerol-treated model group; GL-treated, the low dosage of [6]-gingerol-treated model group.

