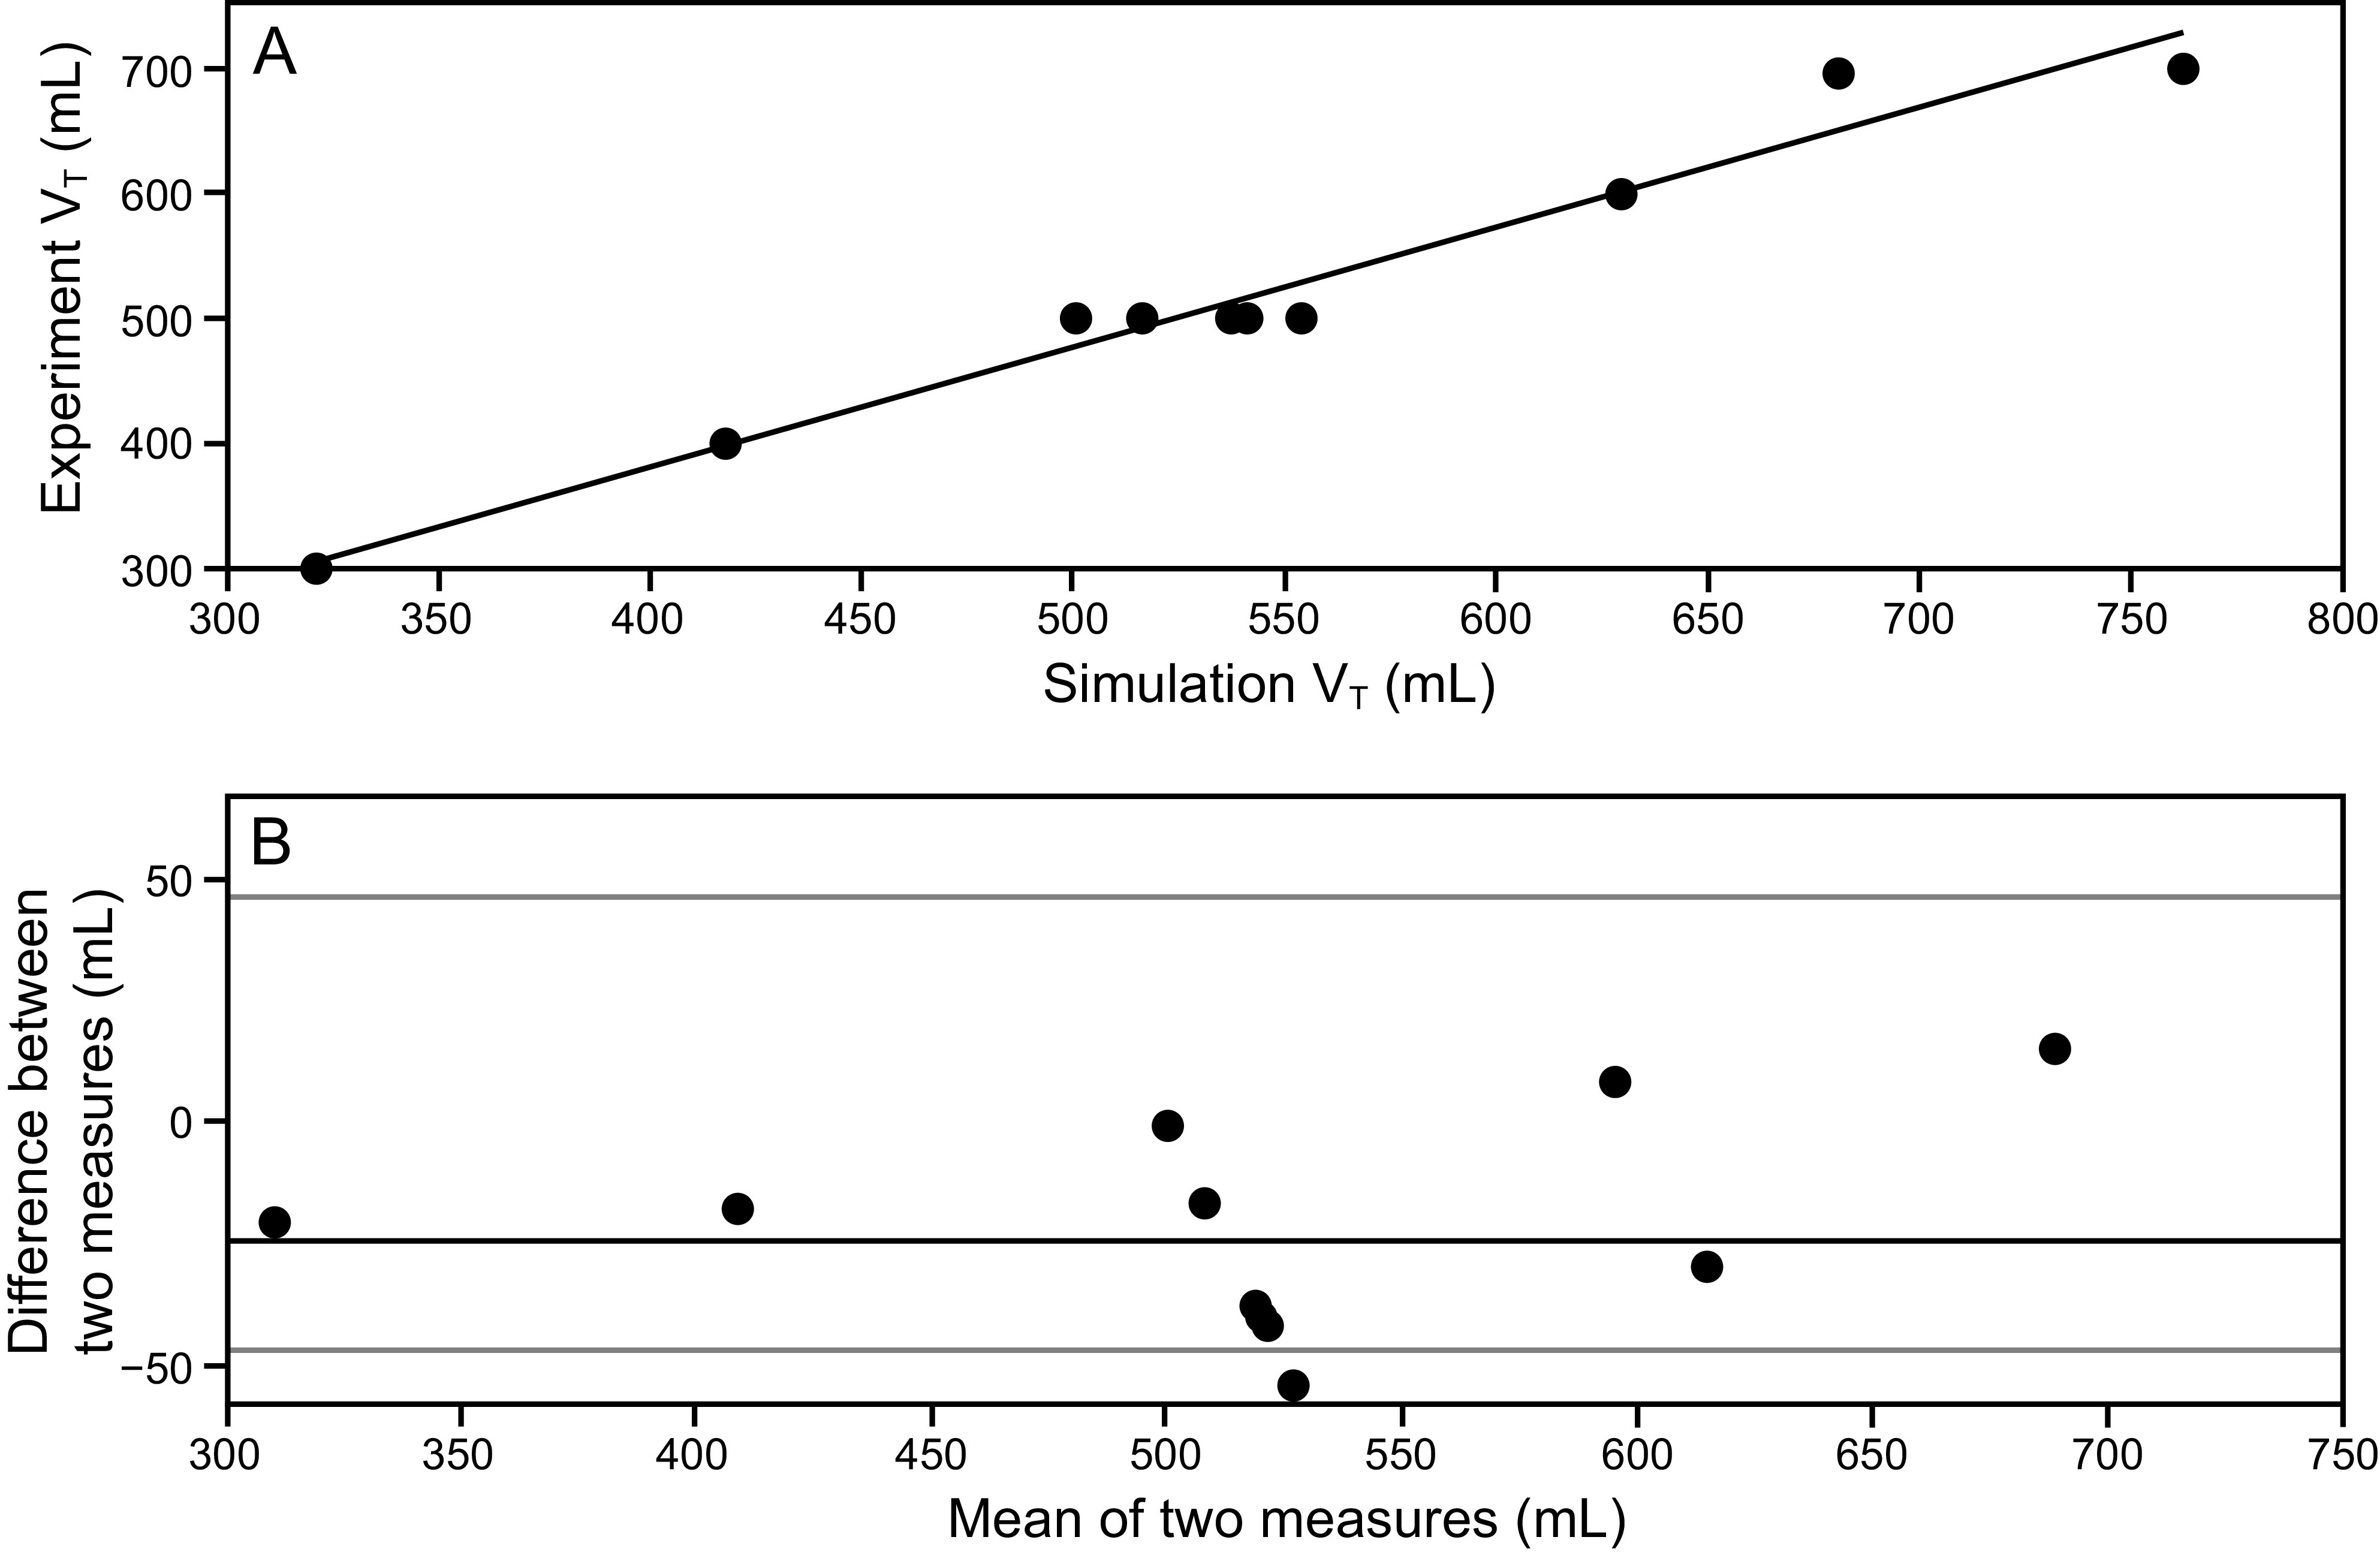
Fig. 2.

Comparison analysis between experiments reported by Branson et al2 and simulations results. A: Correlation analysis between measured and simulated tidal volume. B: Bland-Altman plot, with consistent bias (black line) and 1.96 SD (gray lines).
