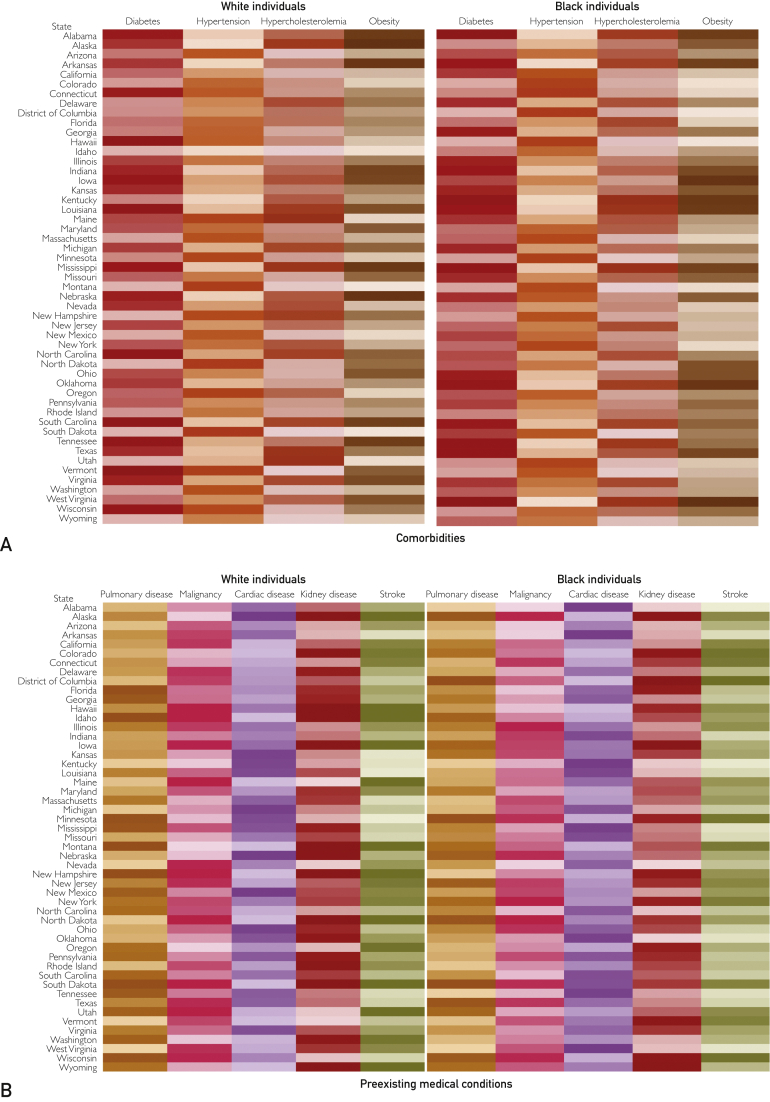
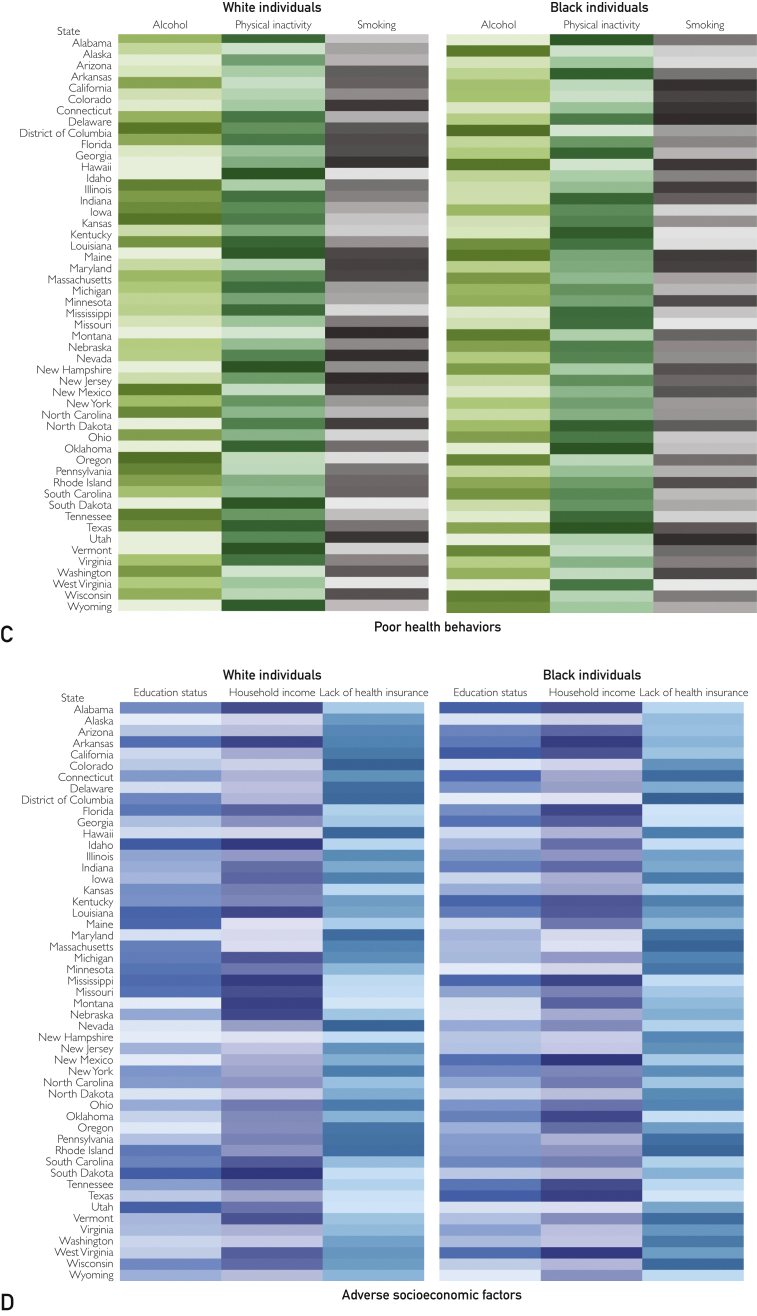
Figure 1.
Heatmap of the prevalence of health determinants, stratified by race. Darker shades represent higher prevalence, and lighter shades represent lower prevalence. Age-adjusted prevalence is reported along with 95% CI. A, Comorbidities. B, Preexisting medical condition. C, Poor health behaviors. D, Adverse socioeconomic factors. The estimates and CIs are given in Supplemental Tables 4 and 5.


