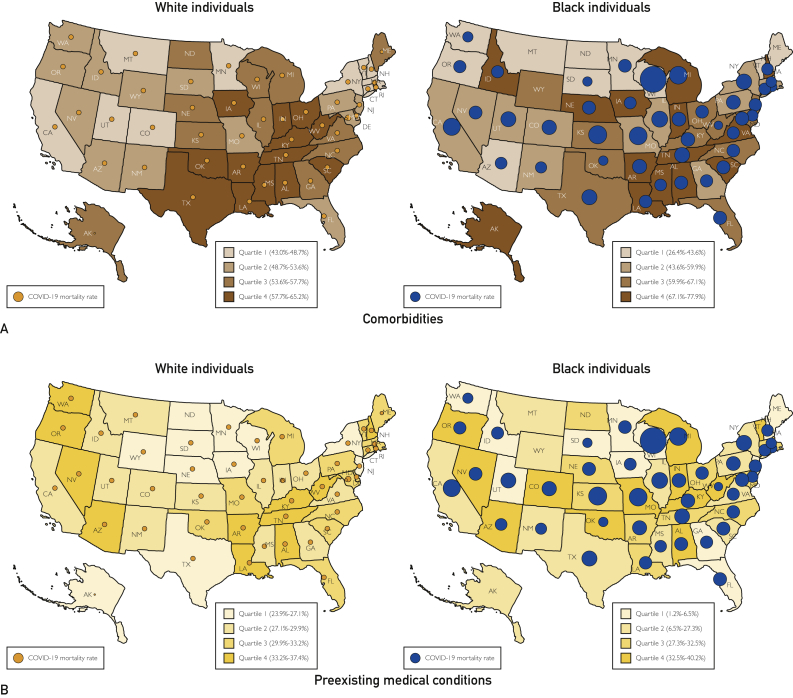
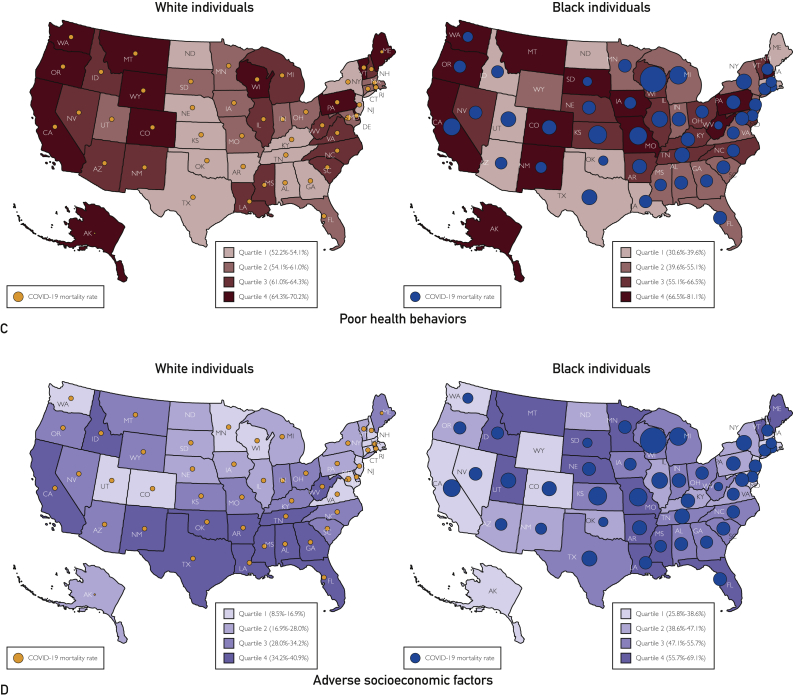
Figure 4.
Geographic distribution of coronavirus disease 2019 (COVID-19) mortality and the prevalence of health determinants, stratified by race. The figure represents the race-stratified state-level prevalence of comorbidities (Panel A), preexisting medical conditions (Panel B), poor health behaviors (Panel C), and adverse socioecomic factors (Panel D). The size of bubbles is proportional to COVID-19 mortality. Purple bubbles represent COVID-19 mortality in whites, and red bubbles represent COVID-19 mortality in blacks.


