. 2020 Sep 22;9:e55744. doi: 10.7554/eLife.55744

Figure 2. Reduced macrophage uptake of non-flagellated and non-motile P. aeruginosa strains.

Phagocytic uptake 1 hr post infection of PA14 and the three motility variants into bone-marrow-derived macrophages (BMDMs) (A) and RAW264.7 cells (B) using a multiplicity of infection (MOI) of 1. The results of at least two independent experiments with three biological replicates are depicted. (C) Adherence of bacterial cells to RAW264.7 macrophages following treatment with 10 µM cytochalasin D to inhibit phagocytic uptake. The initial bacterial load was set to 100% (black, technical replicates) while the bacterial uptake without cytochalasin D is shown as a control. The data of three biological replicates is shown. (D) Left: Representative screen of clinical P. aeruginosa isolates for swimming motility on semi solid agar plates. Right: Analysis of clinical isolates using a negative-staining to identify the presence of flagella. (E) Phagocytic uptake of clinical isolates of P. aeruginosa in RAW264.7 cells 1 hr post infection using an MOI 1 and 10. Mean ± standard deviation of three biological replicates is displayed. **p<0.01; ***p<0.001 in one-way analysis of variance (ANOVA) (post-hoc test: Dunnett).

Figure 2—source data 1. Negative Stain.

Figure 2.

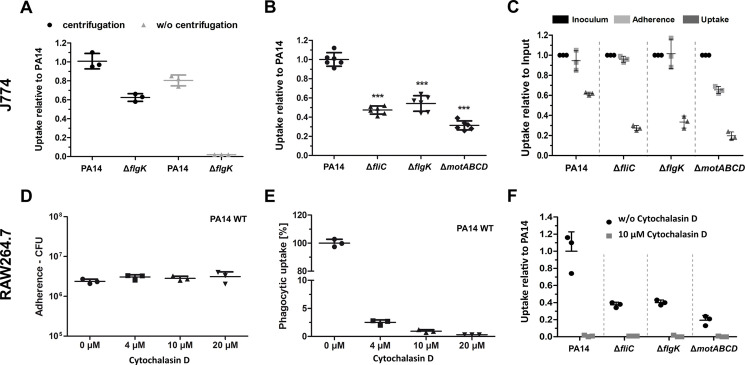
Figure 2—figure supplement 1. Phagocytosis and adherence of P. aeruginosa motility variants.

Figure 2—figure supplement 1.

(A) Influence of a centrifugation step on the bacterial uptake of non-motile ΔflgK by J774 macrophages. Mean ± standard deviation of three biological replicates is displayed (B) Phagocytic uptake of PA14 and its flagella variants 1 hr post infection in J774 cells using an MOI of 1. Mean ± standard deviation of six biological replicates of two independent experiments is displayed (C) Determination of cells that adhere to J774 macrophages. 10 µM cytochalasin D was used to stop phagocytosis. Mean ± standard deviation of three biological replicates is displayed. The inoculated bacteria (black, technical replicates) were set as 100% and the uptake without cytochalasin D served as control. ***p<0.001, one-way analysis of variance (ANOVA) (post-hoc test: Dunnett). (D) Effect of different cytochalasin D concentrations on the adherence of PA14 on RAW264.7 macrophages 1 hr post infection using an MOI of 1. (E) Effect of different cytochalasin D concentrations on the phagocytic uptake of PA14 into RAW264.7 macrophages 1 hr post infection using an MOI of 1. (F) Determination of internalized bacteria in RAW264.7 macrophages upon treatment with 10 µM cytochalasin. Mean ± standard deviation of three biological replicates is displayed.
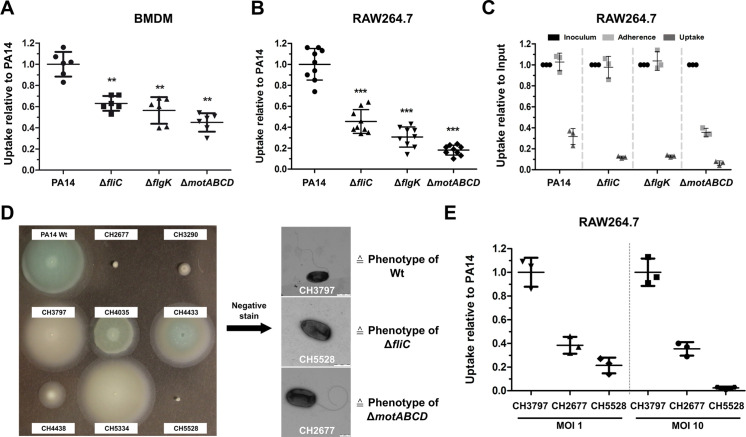
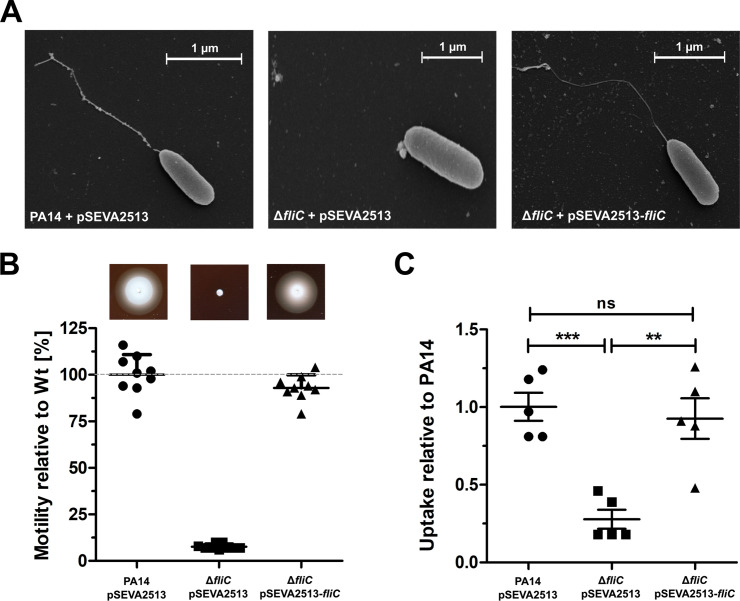
Figure 2—figure supplement 2. FliC complementation restores the wild-type phenotype.

Figure 2—figure supplement 2.

(A) Representative pictures of the individual P. aeruginosa variants analyzed by scanning electron microscopy. (B) Swimming motility assessed on semisolid agar containing 500 µg/ml kanamycin after 16 hr. Mean ± standard deviation of nine biological replicates from two independent experiments is displayed. (C) Phagocytic uptake 1 hr post infection of PA14, ΔfliC and its complemented strain into bone-marrow derived macrophages (BMDMs). Mean ± standard deviation of five biological replicates is displayed. ***p<0.001; **p<0.01 (one-way analysis of variance (ANOVA), Dunnett’s post-hoc test).