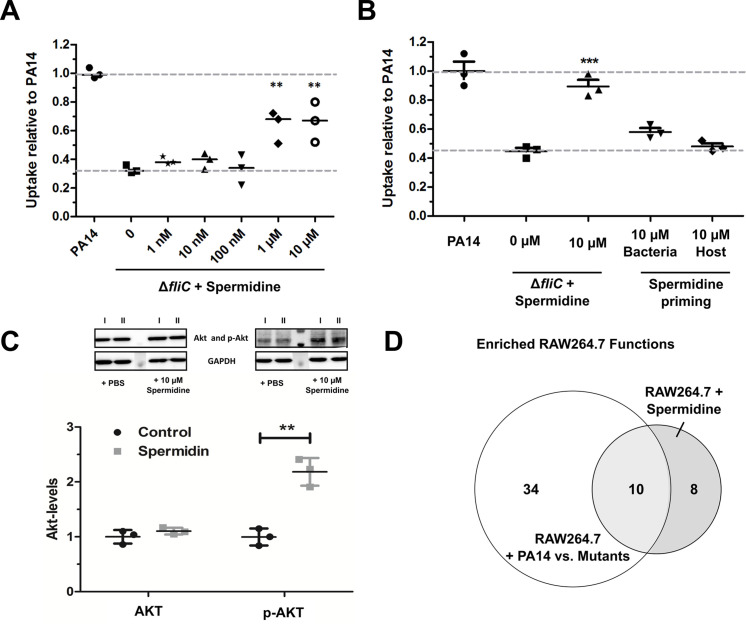
Figure 6. Spermidine enhances phagocytic uptake.
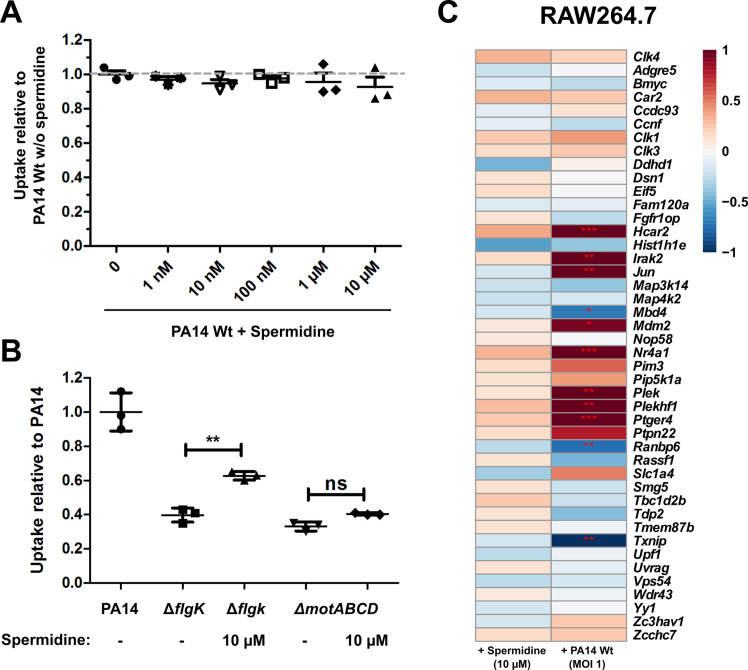
(A) Spermidine was externally added at the indicated concentrations to the ΔfliC mutant. Using MOI of 1, the phagocytic uptake in RAW264.7 macrophages was examined 1 hr post infection. Mean ± standard deviation of three independent experiments are displayed. (B) Determination of phagocytic uptake after priming bacteria or RAW264.7 macrophages with 10 µM spermidine. Mean ± standard deviation of three representative biological replicates is displayed. ***p<0.001, two-way analysis of variance (ANOVA) (C) AKT phosphorylation was assessed and quantified by western blot following incubation of RAW264.7 macrophages for 1 hr with 10 µM spermidine. PBS treated cells served as control. N = 3. **p<0.01, two-way ANOVA (D) The transcriptional profile of spermidine-treated RAW264.7 macrophages was accessed and functional enrichment (of top 100 genes) was compared to the PA14-specific response (intersection of enriched functions from top 1000 genes of ΔflgK, ΔmotABCD, and ΔfliC versus PA14 genes) of the macrophages. Venn diagram to illustrate the overlap of enriched (FDR ≤ 0.1) functions among genes that were differentially regulated following spermidine treatment and infection with PA14. The Venn diagram contains functional categories as a result of the functional enrichment using the DAVID tool with default categories (e.g. GO terms, COG ontology, and KEGG pathways).


